
The InterMarket Review
In-depth analysis, proprietary charts and Martin’s unique perspective of the world’s markets.
A must have for any serious investor.
A 40+ page monthly publication which will keep you current on the Global, U.S. Bond, stock, and precious metal markets. Each issue also contains up-to-date information on currencies, international debt, equity markets and commodity indices.
Trusted by professional money managers and portfolio advisors around the globe, as well as individuals managing their own portfolios.
Over 40 years of technical analysis experience
Right at your fingertips.
Martin J. Pring entered the financial markets in 1969 and has grown to become a leader in the global investment community. Since 1984, he has published the “InterMarket Review”, a monthly market letter offering a long-term synopsis of the world’s major financial markets.
Described by Barron’s as a “technician’s technician”, Martin’s articles have been featured in Barron’s, and he has been quoted in The Wall St. Journal, Financial Times, The New York Post and Los Angeles Times newspapers as well as the National Review.
Many of our subscribers have been with us for over a decade, some over two, and have become like family. If you have a question or comment, we’re always here to help! Sign up today and set your financial feet on the road to successful trading strategies by reading the InterMarket Review!
A monthly roadmap to guide your investing process.
Play the video below to tour the InterMarket Review.
InterMarket Review via E-mail (3-month trial) $75.00, automatic renewal quarterly $115.00
Publishing a synopsis of the world’s Intermarket Analysis for over 35 years.
The key ingredients for success.
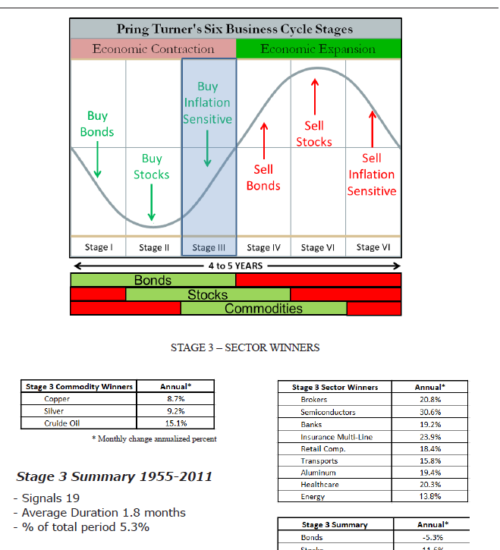
The Six Stage Business Cycle Approach
The six-stage model can help investors dynamically adjust asset allocations around the typical business cycle sequence. Certain asset classes are favored (green) or de-emphasized (red) during specific times in the cycle.
Anyone with gardening experience understands that it is difficult to plant in the winter because nothing grows. The same is true for the financial seasons in the business cycle, where investors can use knowledge of the chronological bond, stock and commodity sequence to create a financial market calendar. By better understanding these financial seasons and using the correct forecasting tools, investors can make well-informed decisions and dramatically improve their chances for investment success.
Click to read Pring Turner’s complete article on asset allocation.
Asset Allocation Recommendations
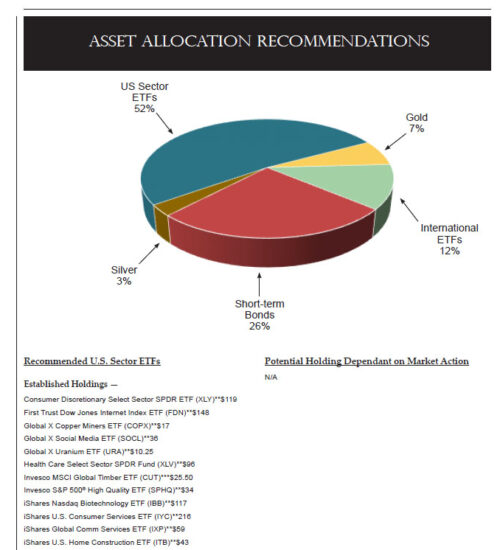
The purpose of our allocations is to summarize our thinking about the markets in a practical, executable way. For example, we might conclude from the position of our indicators that inflation hedge stocks and commodities are headed higher. In that instance, the allocation page would be used to emphasize those views by recommending inflation driven sectors, resource-based country ETFs, such as Canada and Australia, as well as commodity index ETFs or individual commodity ETFs.
Various asset classes and sectors perform differently in different parts of the business cycle. Our recommendations are usually consistent with the prevailing stage flagged by our models. Technical factors we take into consideration are long-term moving averages, such as the 12-month or 65-week time span, the absolute long-term KST, relative action and the long-term KST for relative action. Individual US equity sectors are compared to the S&P Composite and country ETFs to the MSCI World Stock ETF (ACWI).
In most instances, risk management stop losses are recommended. The stop will typically be placed below a previous short-term low or more commonly under a 65-week EMA. Each month the stop levels are reviewed and where possible are raised. When a market or sector is considered vulnerable, stops will be tightened aggressively.
Current Sector Positions
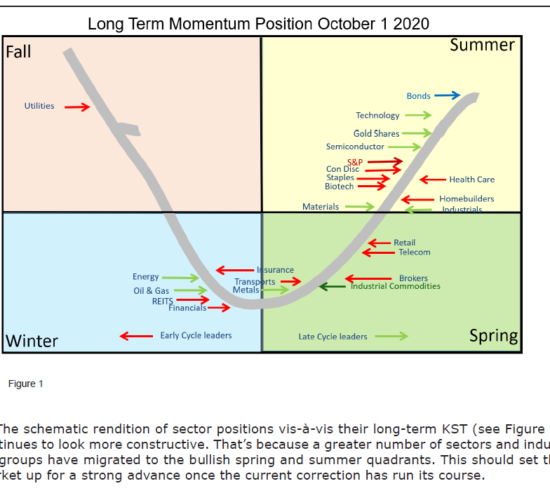
Long-term smoothed momentum (KST) is an integral part of our analysis. The diagram to the left represents a theoretical example. Featured each month together with the actual KST position of individual sectors. The diagram serves two functions. First, it tells us the state of the market. At the peak of the 2002-2007 bull market for instance, there was a conglomeration of sectors in the bearish “fall” quadrant. Compare that to the 2009 bottom (not shown), which experienced a concentration of sectors in the bullish spring and winter positions.
Second, it tells us where individual sectors or industry groups are positioned. Red arrows reflect sectors that tend to do well at the start of the bull market and green for those tending to outperform at the later stages of the cycle. Accumulation is best done in the spring quadrant and new purchases generally avoided in the fall.
InterMarket Review via E-mail (3-month trial) $75.00, automatic renewal quarterly $115.00
Proprietary Stock Barometer
There is no such thing as a perfect indicator, but our Stock Barometer is the next best thing! Combining six consistently profitable components into one, it has been designed to avoid business cycle associated bear markets and keep false signals to a minimum. We also feature similar models for bonds and commodities in each issue.
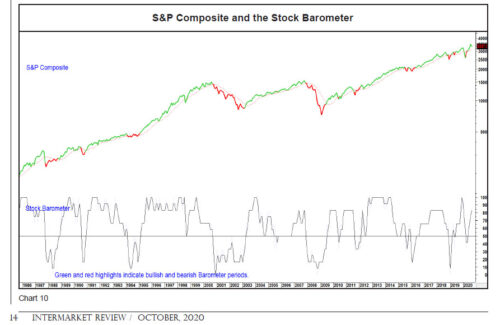
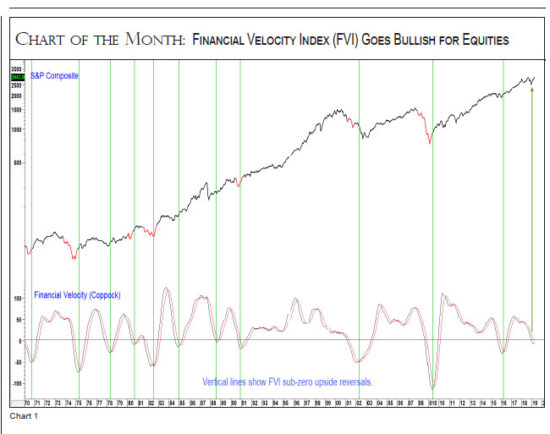
Chart of the Month
Each month we feature one chart that has either given us a major buy or sell signal or that looks as if it might be close to one. The one to the left was taken from the May 2019 issue and shows that our Financial Velocity Index had just triggered a cyclical buy signal.
InterMarket Review via E-mail (3-month trial) $75.00, automatic renewal quarterly $115.00
