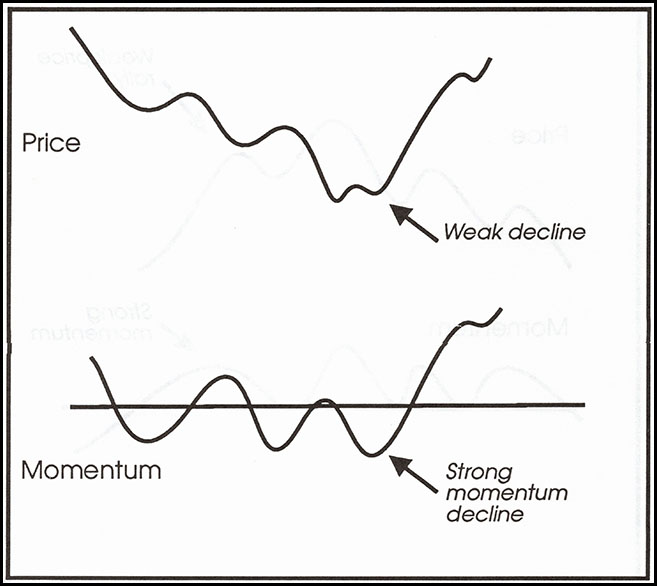
When price and momentum are moving in the same direction, they are said to be “in gear.” There’s nothing important to be learned from this state of affairs except that the trend is healthy. However, when momentum doesn’t confirm the price, be aware that the prevailing trend may be about to reverse. In the description of overbought and oversold conditions, we assumed that the oscillator peaks and troughs at roughly the same time as the price. This is not often the case, however. An equally likely possibility is that the momentum indicator will turn ahead of the price. Think of a pen thrown into the air. The pen reaches its point of maximum velocity the instant it leaves the hand. It continues to rise, but at a slower and slower rate until it’s overcome by the force of gravity. Only then does it begin to fall back toward the ground. The same effect occurs figuratively in the marketplace, where the price action is the pen and the momentum indicator depict the velocity of its rise. Figure 1 looks at momentum in a slightly different way. It shows the price appreciating in every period, first in increasing amounts, later in smaller increments. This example shows quite clearly not only how the price continues to rise, but also how the speed or velocity of the advance decelerates before the final peak. A momentum indicator measures this acceleration and deceleration factor and presents it in a graphic format.
Figure 1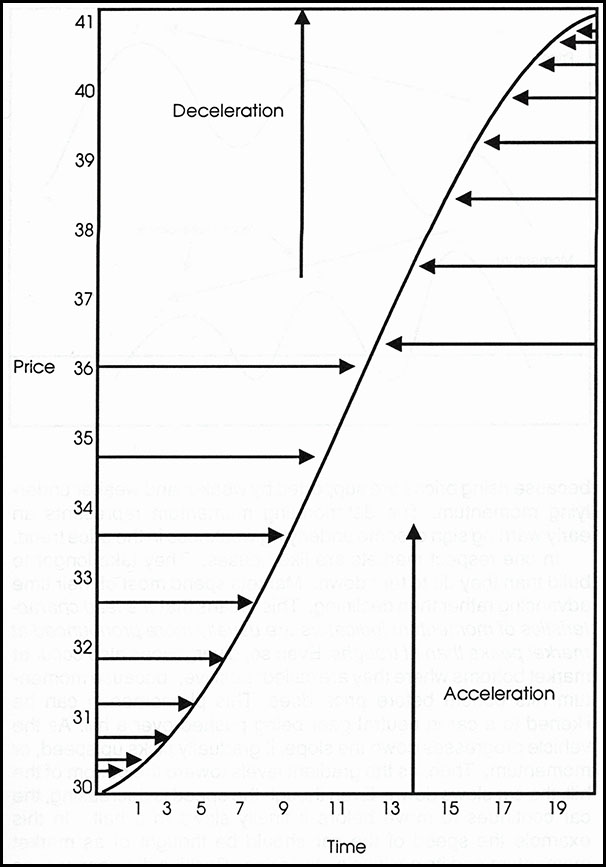
Figure 2 shows how this works in practice. Point A marks the point of maximum velocity, but the price continues to rally at a slower and slower pace until Point C. This conflict between momentum and price is known as divergence since the oscillator is out of sync with the price. It’s also called a negative divergence because rising prices are supported by weaker and weaker underlying momentum. The deteriorating momentum represents an early warning sign of some underlying weakness in the price trend.
.
Figure 2
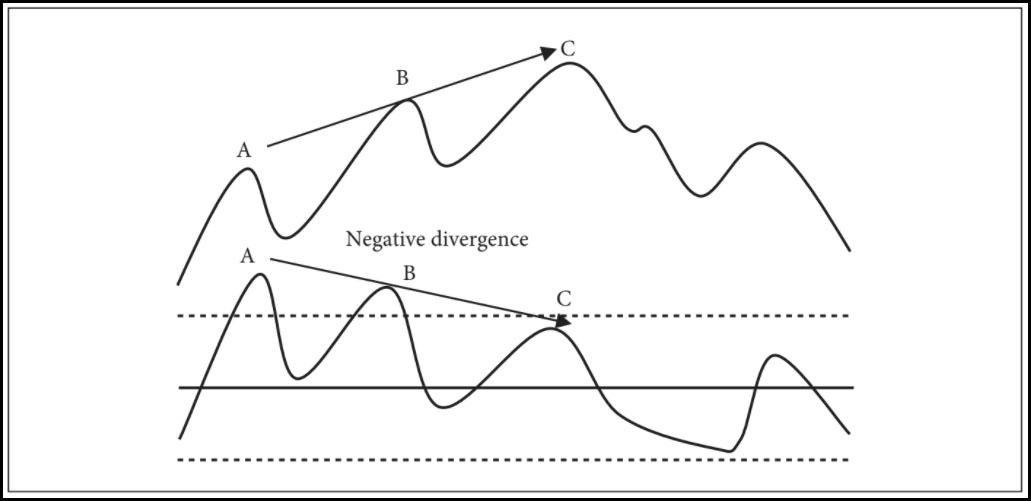
In one respect, markets are like houses. They take longer to build than they do to tear down. Markets spend most of their time advancing rather than declining. This means that the lead characteristics of momentum indicators are usually more pronounced at market peaks than at troughs. Even so, divergences also occur at market bottoms where they are called positive because momentum hits bottom before price does. This phenomenon can be likened to a car in neutral gear being pushed over a hill. As the vehicle progresses down the slope, it gradually picks up speed, or momentum. Then, as the gradient levels toward the bottom of the hill, the car slows down. Even though the speed is decreasing, the car continues to move before it finally slows to a halt. In this example, the speed of the car should be thought of as market momentum and its position the price. Positive divergences, as shown in Figure 3, tell us that even though a price is declining, it’s declining at a slower and slower rate. In this instance, the technical position is said to be improving, or getting stronger. Indeed, if you think a market is in the process of reaching its bottom and you don’t see a divergence, you may want to reconsider your analysis because most market bottoms are preceded by at least one positive divergence.
Figure 3
It’s very important to note that although they indicate either a deteriorating or an improving market condition, divergences do not, on their own, signal that the prevailing trend has reversed. That signal can come only from some kind of trend-reversal sign generated by the price itself. This cue could take the form of a price-pattern completion, a moving-average crossover, or some other signal. When this occurs, technicians say that the divergence has been confirmed by the price.
Interpreting negative momentum divergences can be compared to watching a moving car that has a mechanical problem. The car has just begun to make a clanking noise. Nevertheless, the driver is still able to propel the car faster and faster because the problem is in its early stages. To an observer from afar who cannot hear the noise, it appears the car is in great shape.
Similarly, in the case of a negative-momentum divergence, a market observer can see that the price is moving higher and higher. It would seem to him that the trend is perfectly healthy. Indeed, the fact that prices are advancing gives a misplaced sense of confidence. Yet, if he could see that the underlying momentum is deteriorating, he would be far more inclined to sell. By the same token, the driver of the car, aware from the din under the hood that some serious trouble was developing, would be inclined to visit the repair shop or risk a breakdown. Thus, if we accept the premise that a malfunctioning car is likely to require more attention the longer an engine problem is ignored, then we should agree that the greater the number of divergences an indicator shows, the more serious the consequences of a reversal in trend when it inevitably takes place.
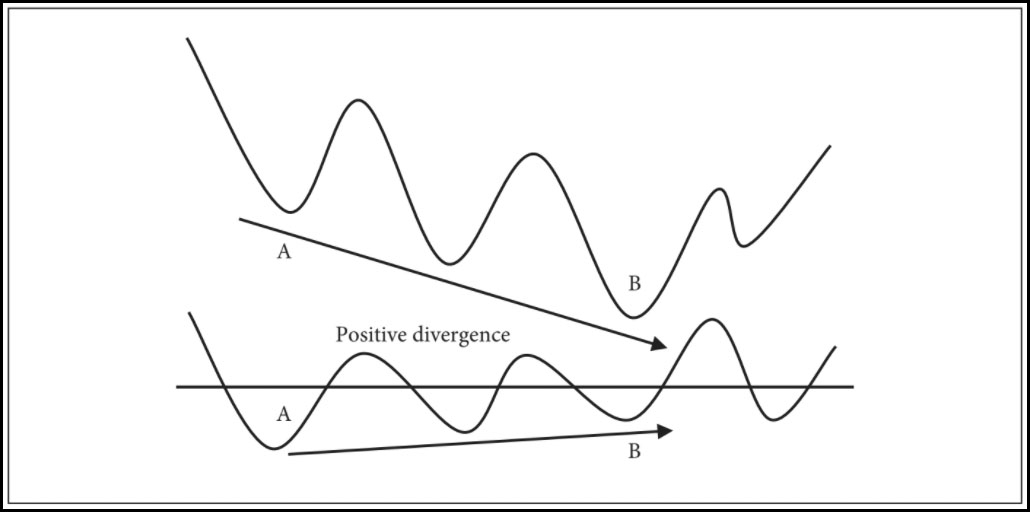
Figure 4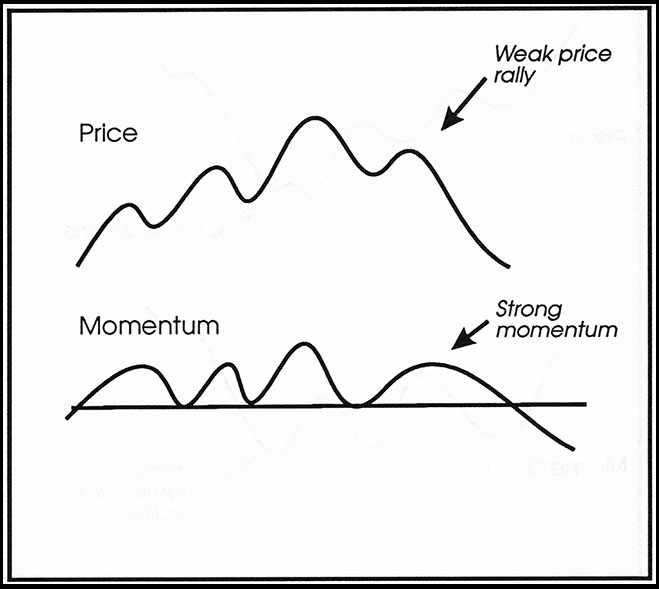
Another sign of a mature trend occurs when the momentum index moves strongly in one direction, but the price fails to follow through with any degree of gusto. This indicates that the price is tired of moving in the direction of the prevailing trend; for despite the strong momentum, thrust prices are unable to respond. This is an unusual but nevertheless powerful phenomenon. Figures 4 and 5 indicate this phenomenon for both market tops and bottoms respectively.