The Pring Turner Leading Economic Indicator (PTLEI) has been constructed to warn us when a recession is likely to start, and a contracting economy offers sporting chance of transitioning into a recovery. It has achieved that goal since its inception in 1956. The only false negative in 70+ years of history developed in 1966. Like almost every other LEI, it was a little late in signaling the 2020 pandemic inspired recession.
The indicator is constructed from a weighted average of monthly changes in four leading sectors of the economy. These forward-looking indicators comprise housing starts, a leading employment series, real retail and food services sales and the S&P Composite. It therefore embraces housing, the labor market, consumer spending (2/3 of the economy) and animal spirits in the form of the stock market. Being able to reliably assess future economic conditions helps us to identify turning points in bonds stocks and commodities.
Chart 1 compares the Index to the Conference Board’s Coincident Indicator. Peaks in this latter series typically develop at the start of a recession. The beginning of these contractions in business activity have been flagged by the vertical lines, the red highlights flag the contractions themselves. The arrows plotted against the PTLEI approximate the lead times between the two tops.
Chart 1 — The Pring Turner LEI versus the Conference Board’s Coincident Indicator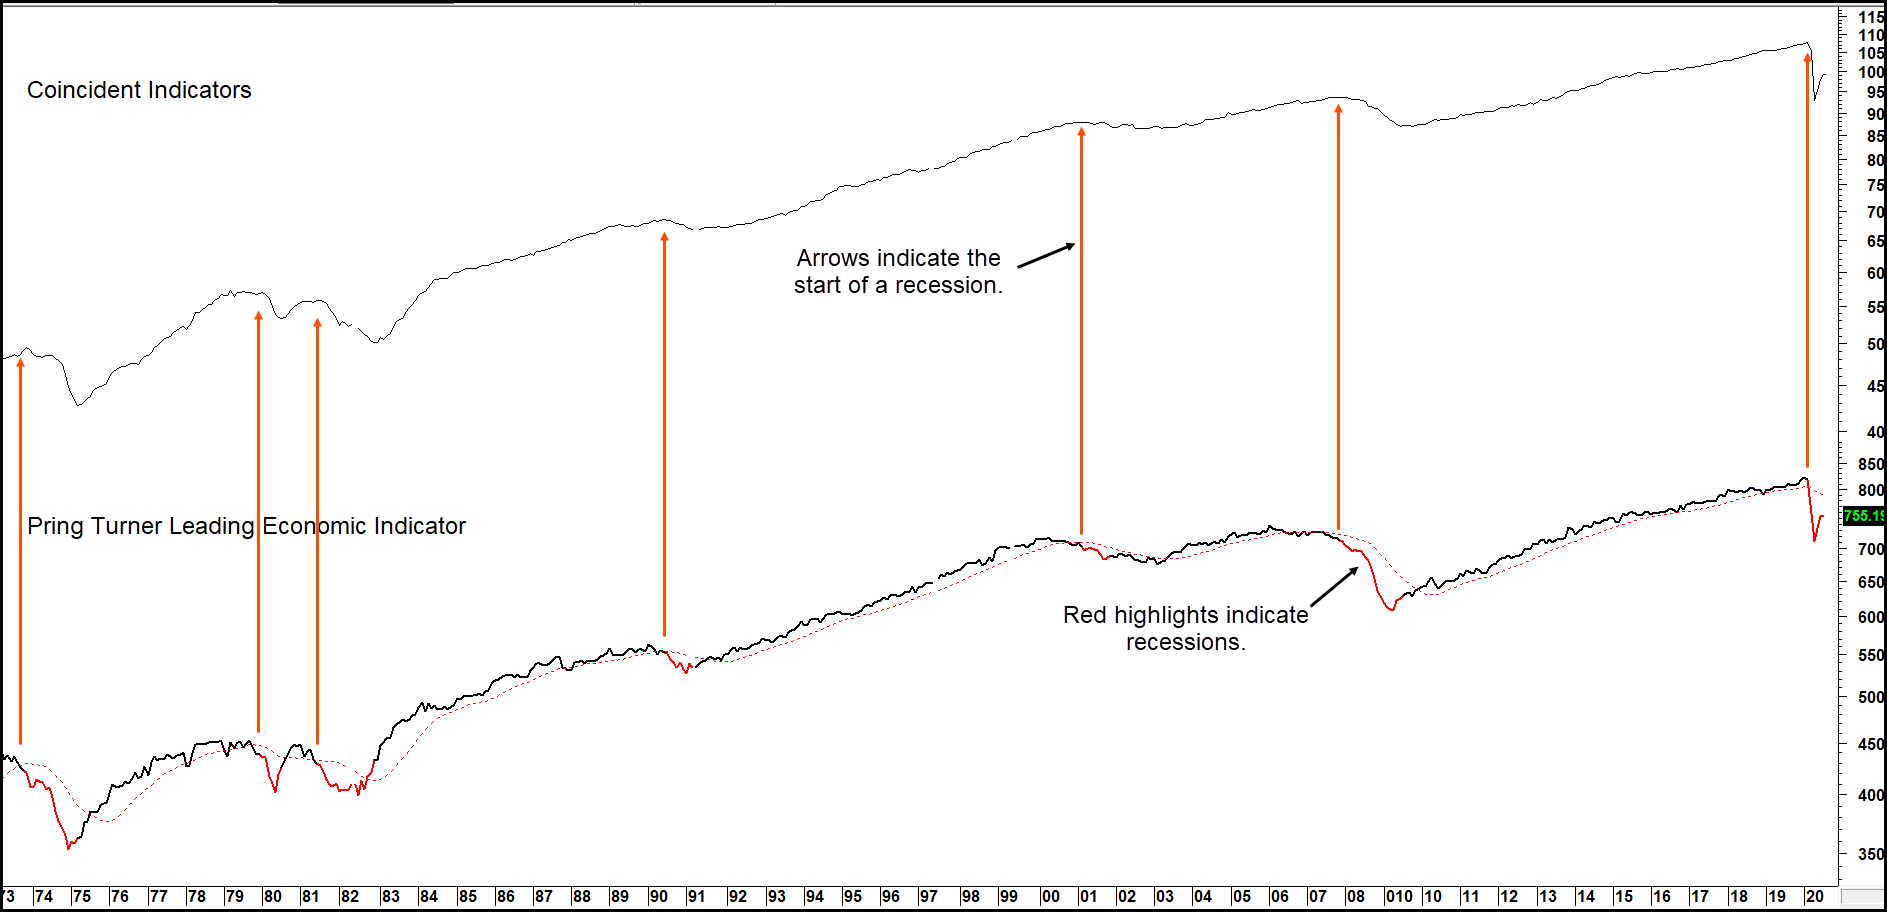
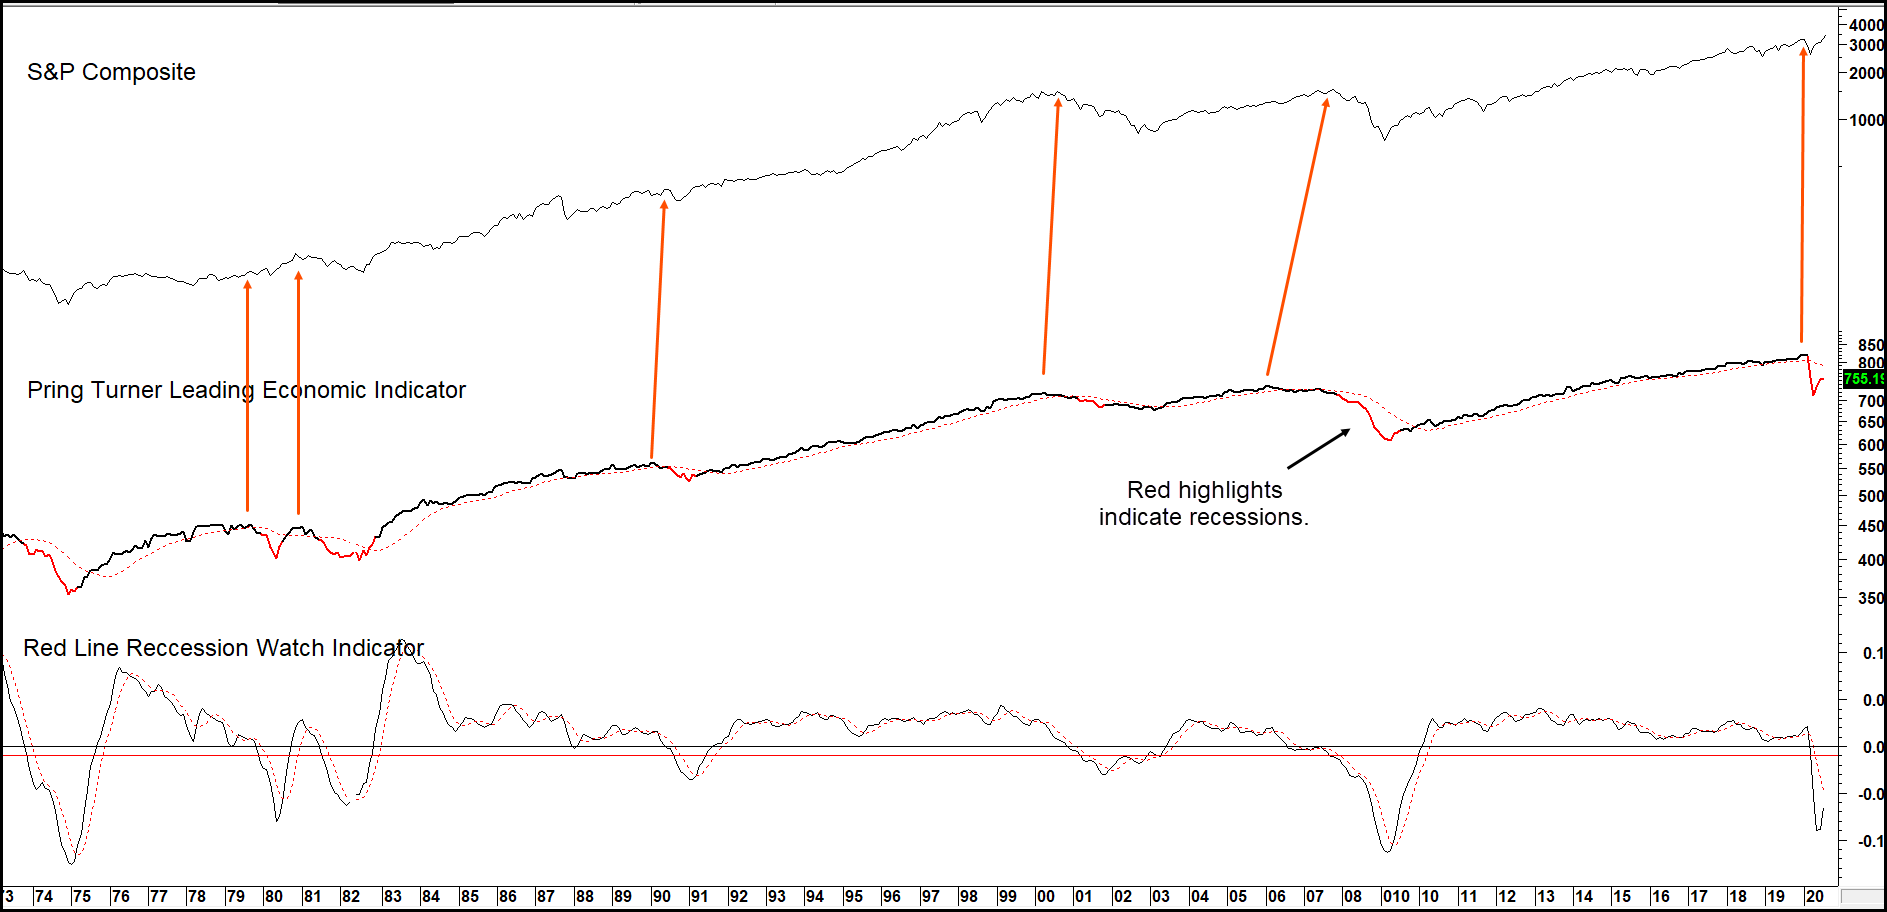
The second and third charts show that while the indicator itself leads the economy by varying amounts, it’s the growth path of the PTLEI itself that is more accurate in signaling recessions. The turning points of this momentum indicator are also easier to spot. Those warnings come when it slips slightly into negative territory below the (red) recession line. Such action typically offers a warning that the economy has entered a contractionary phase. That’s why we named it the Recession Watch Indicator.
Chart 2 — The Pring Turner Leading Economic Indicator versus the Recession Watch Indicator 1955 – 1978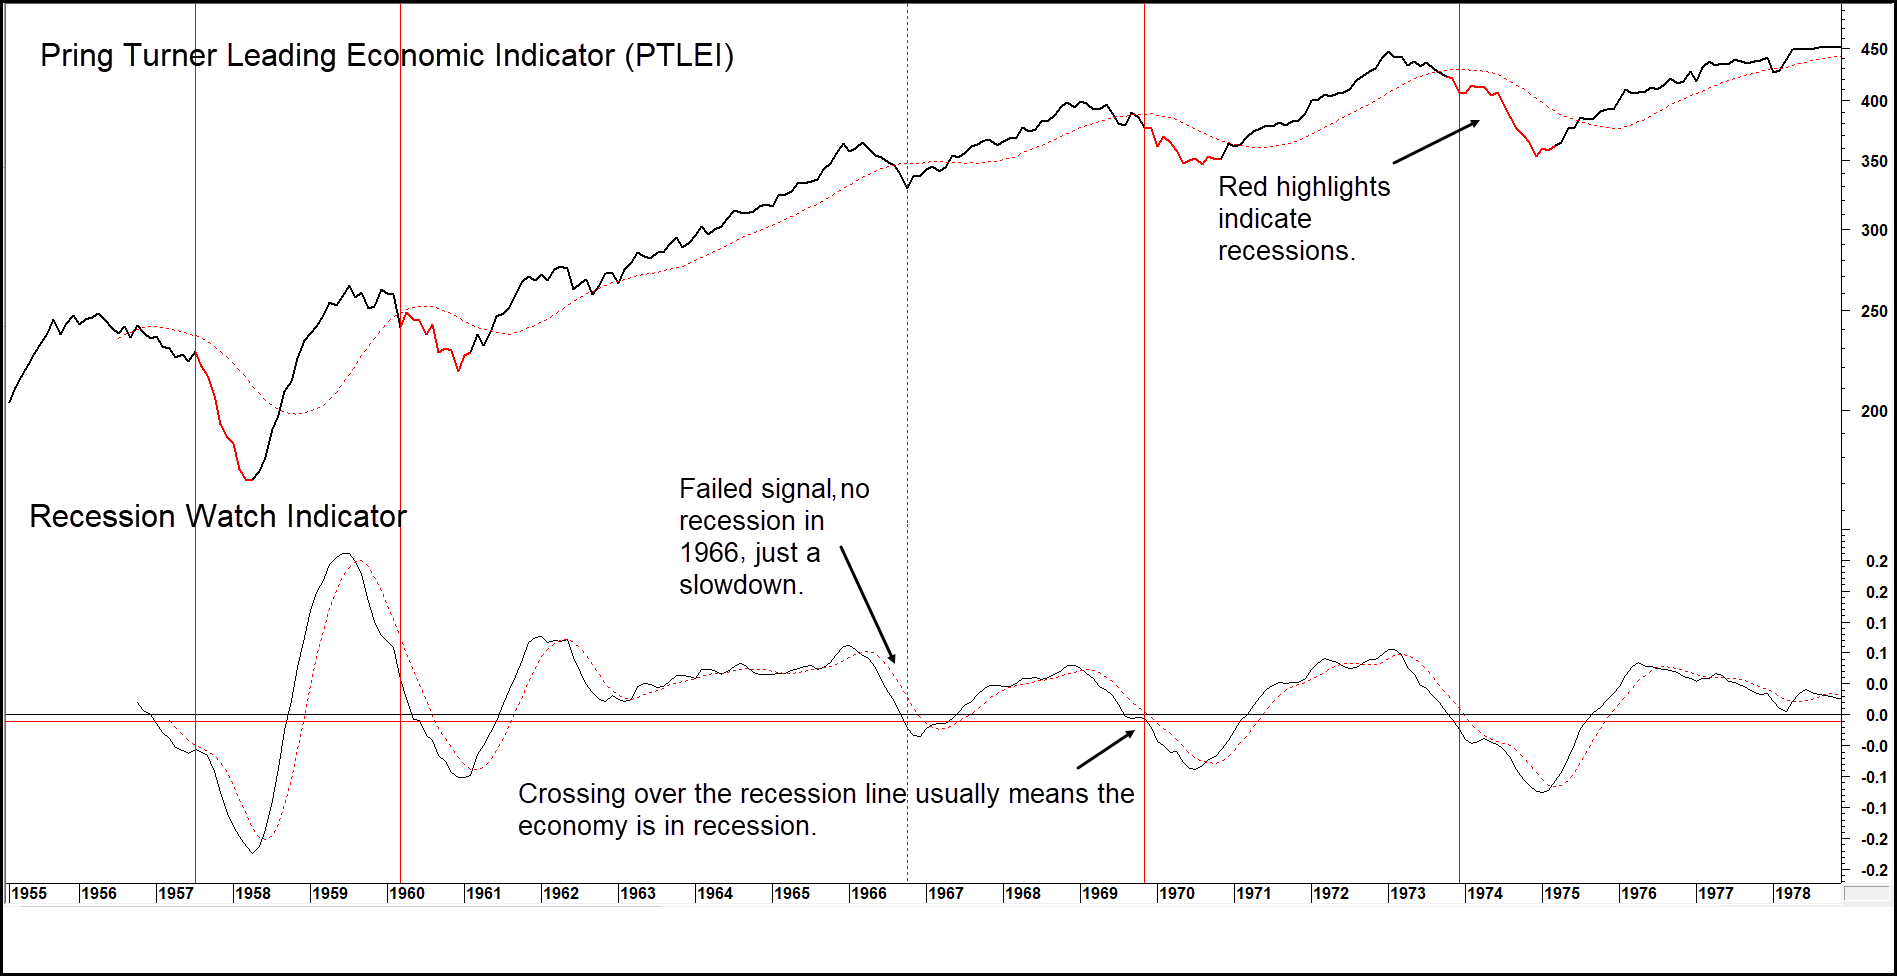
Chart 3 — The Pring Turner Leading Economic Indicator versus the Recession Watch Indicator 1973 – 2020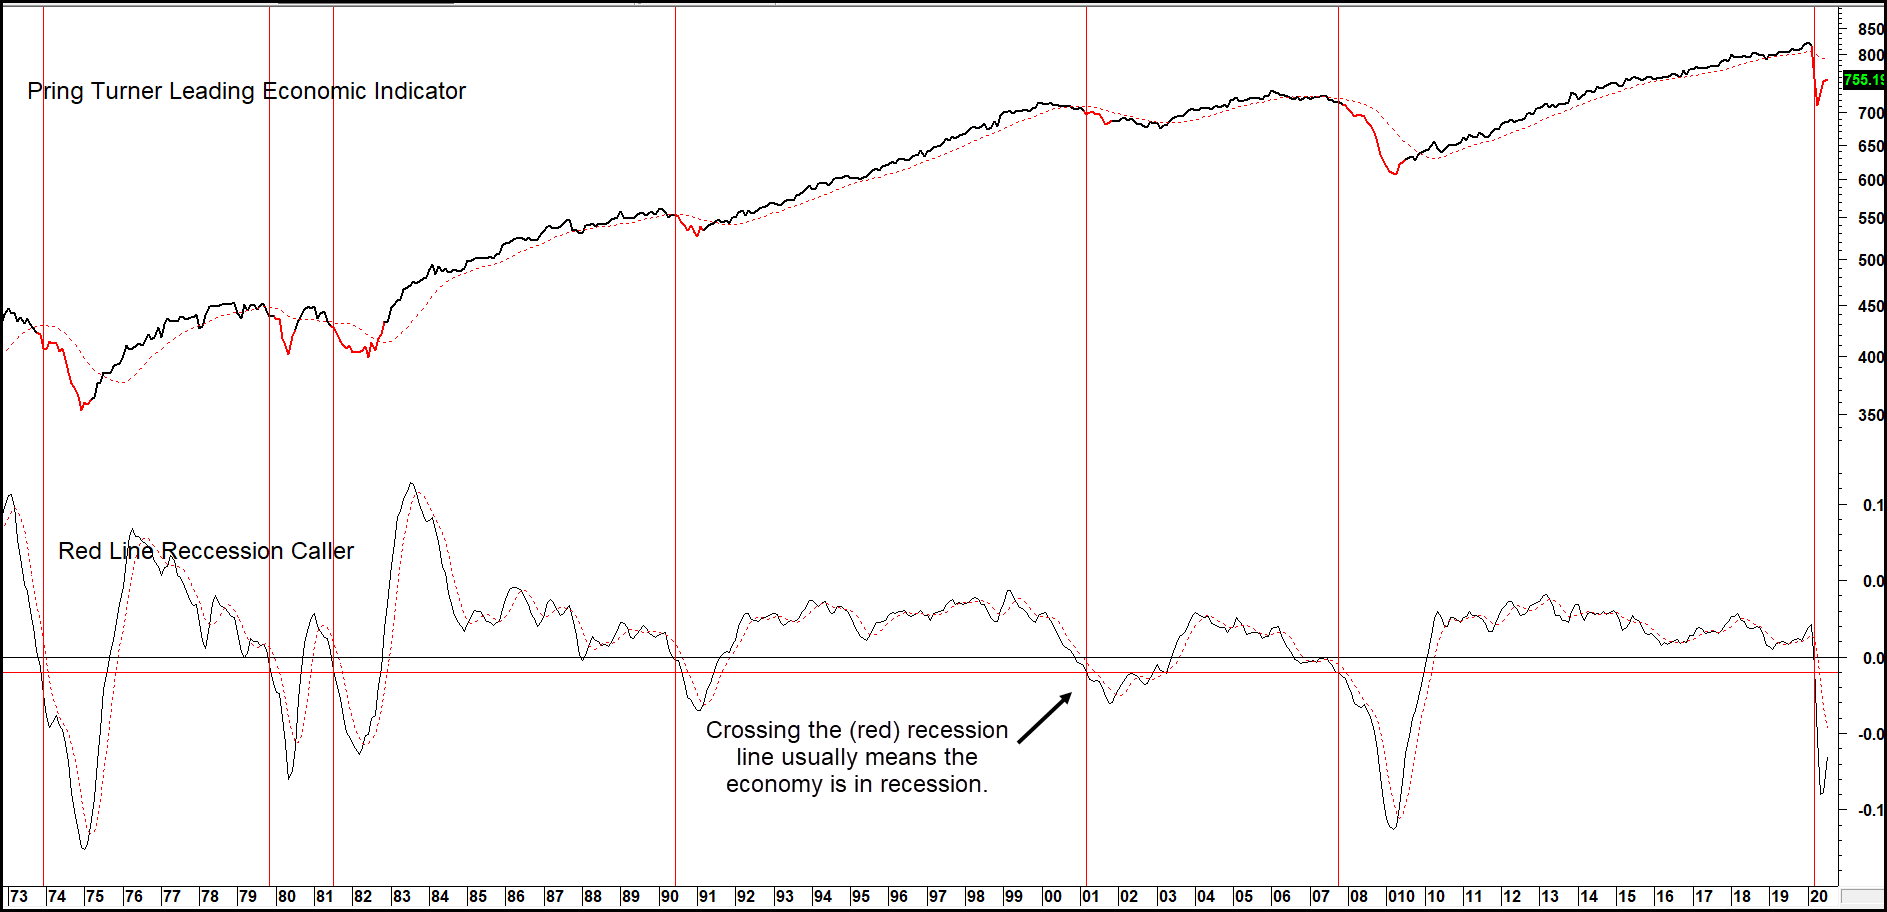
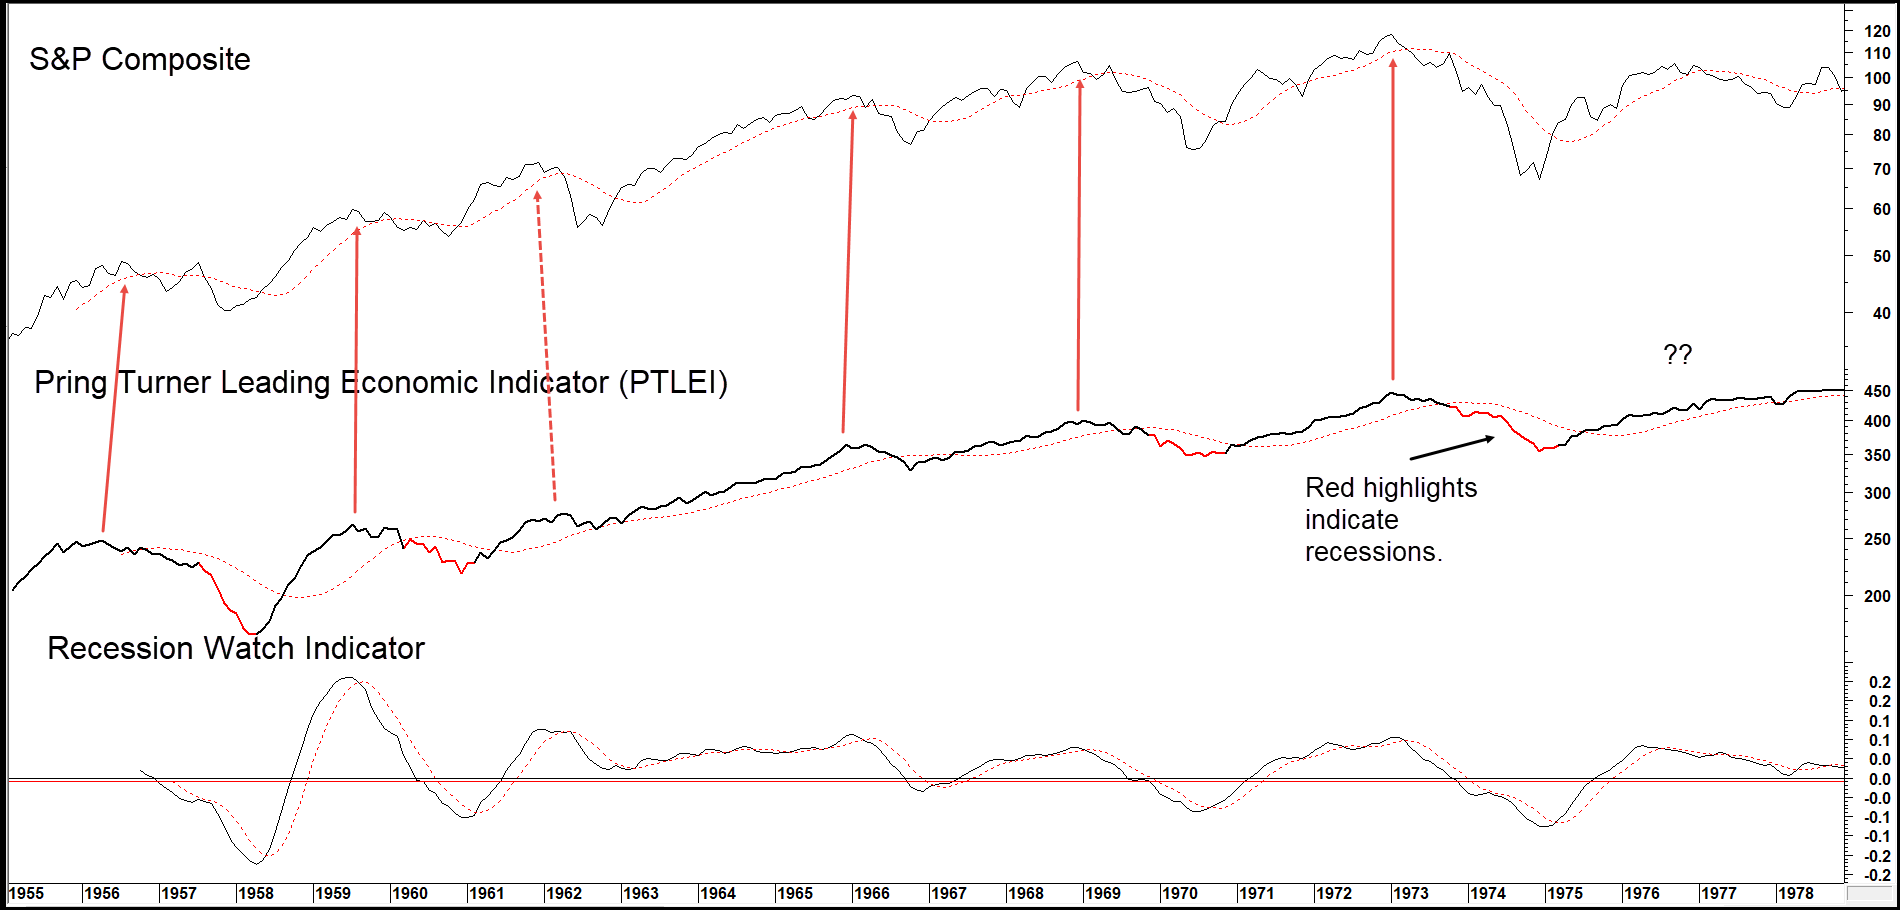
Charts 4 and 5 compare the indicator to the S&P Composite, where the close relationship between these two series can be appreciated.
Chart 4 — The Pring Turner Leading Economic Indicator versus the S&P Composite 1955 – 1978