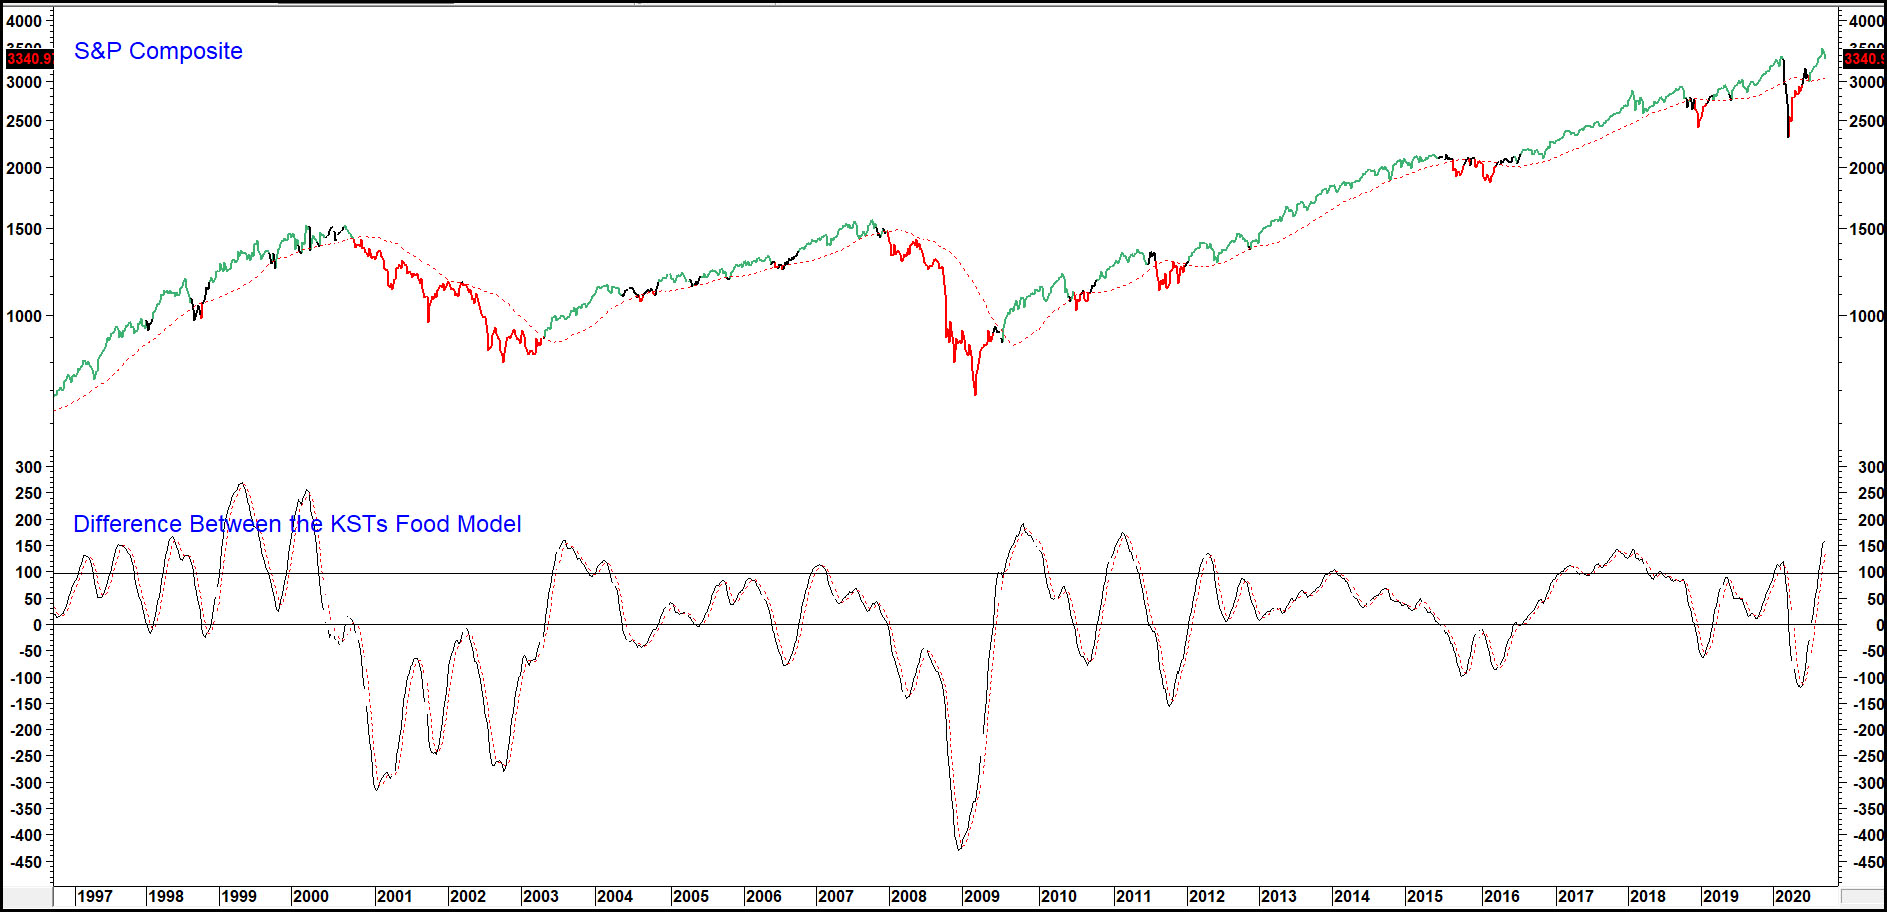
When conservative, defensive stocks such as food manufactures are outperforming the market, it’s generally a bad thing because it indicates investors are in a cautious mode. Conversely, when foods are doing poorly in terms of relative performance, that’s positive for the market since it means that more aggressive equities are being accumulated.
Our food model reflects this by comparing a momentum measure of the S&P to a similar measure for the relative performance of the S&P Food Group. The indicator we use, in both situations, is the intermediate KST. Chart 1 sets the scene in the bottom window where these indicators are overlaid on each other. When the green S&P crosses above the blue food relative KST, it indicates investors are growing in confidence and earns a green highlight on the chart. Conversely, bearish signals are triggered when the food RS crosses above the S&P intermediate KST. That earns a red highlight against the S&P itself.
The series in the middle window calculates the difference between the two series, which means that zero crossovers trigger the buy and sell signals. See how the vertical lines flag bull and bear signals.
Chart 1 — The Food Model 2010 – 2018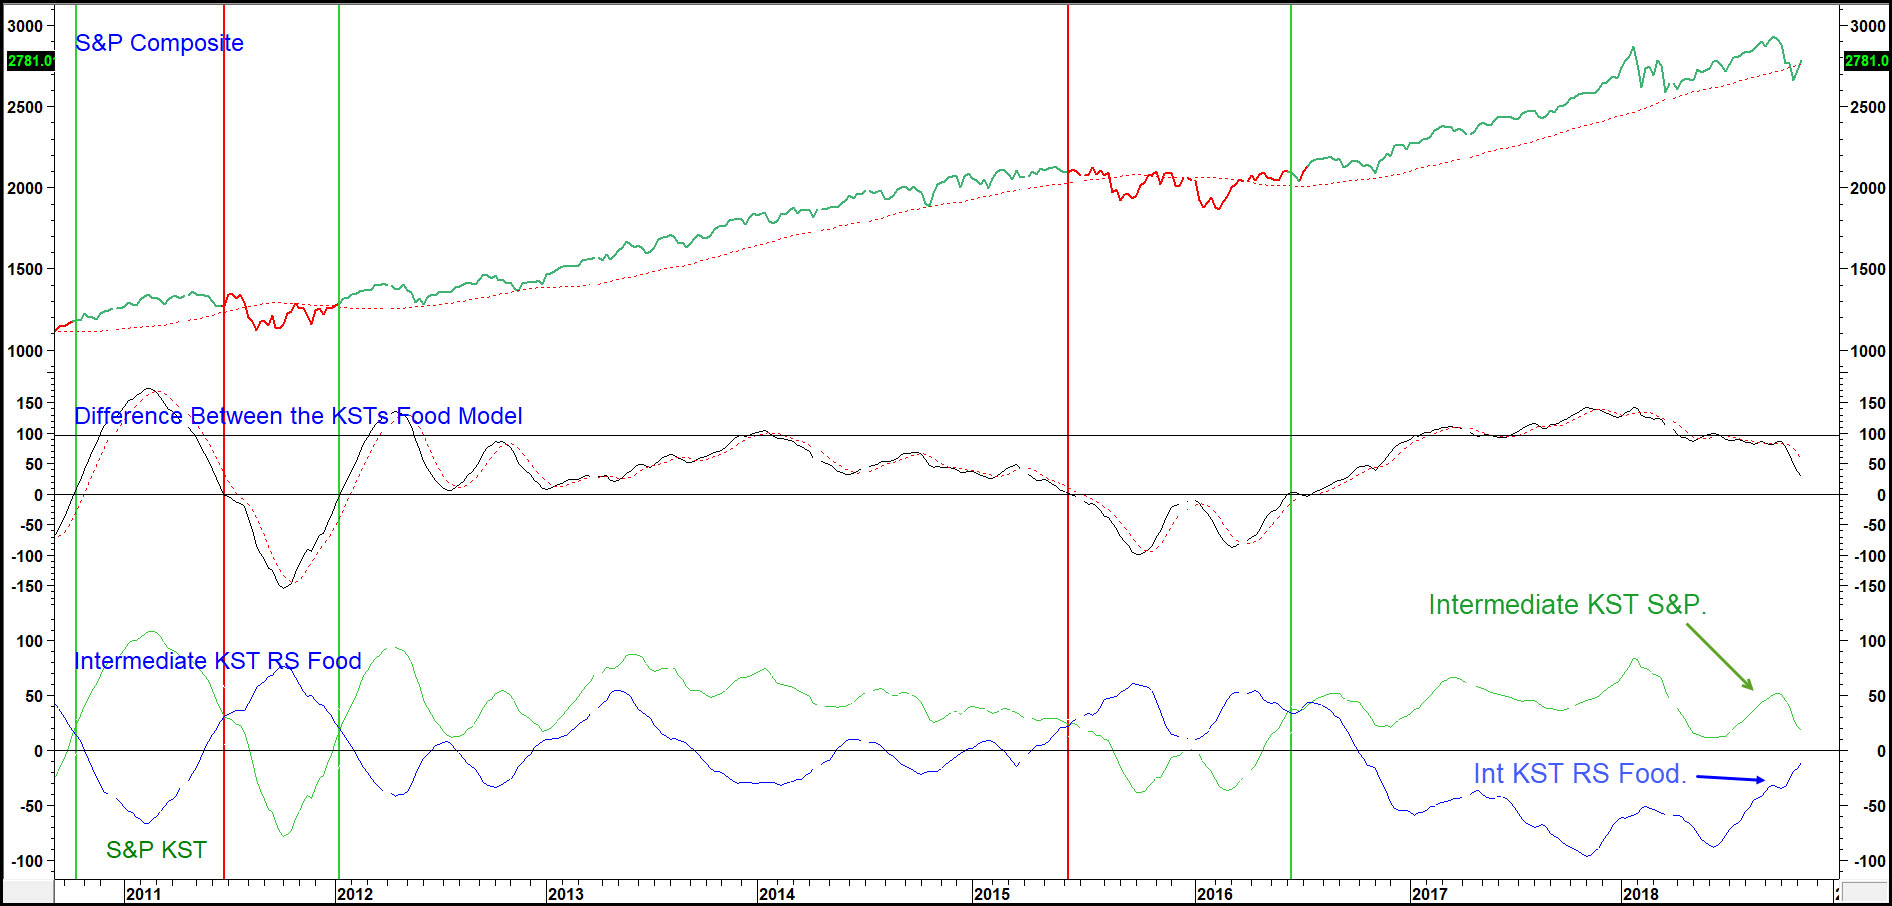
Charts 2 and 3 feature the history of this approach going back to the late 1970s. In this instance a black highlight has been added. That’s because in order to go bullish, the model requires a KST crossover and the S&P crossing above or below its 40-week MA (advanced by 7 weeks). If there is a conflict between the KST crossover and the S&P trend, that’s regarded as neutral and earns a black highlight. When both conditions are satisfied, the result is aa green or red highlight.
Chart 2 — The Food Model 1977 – 1997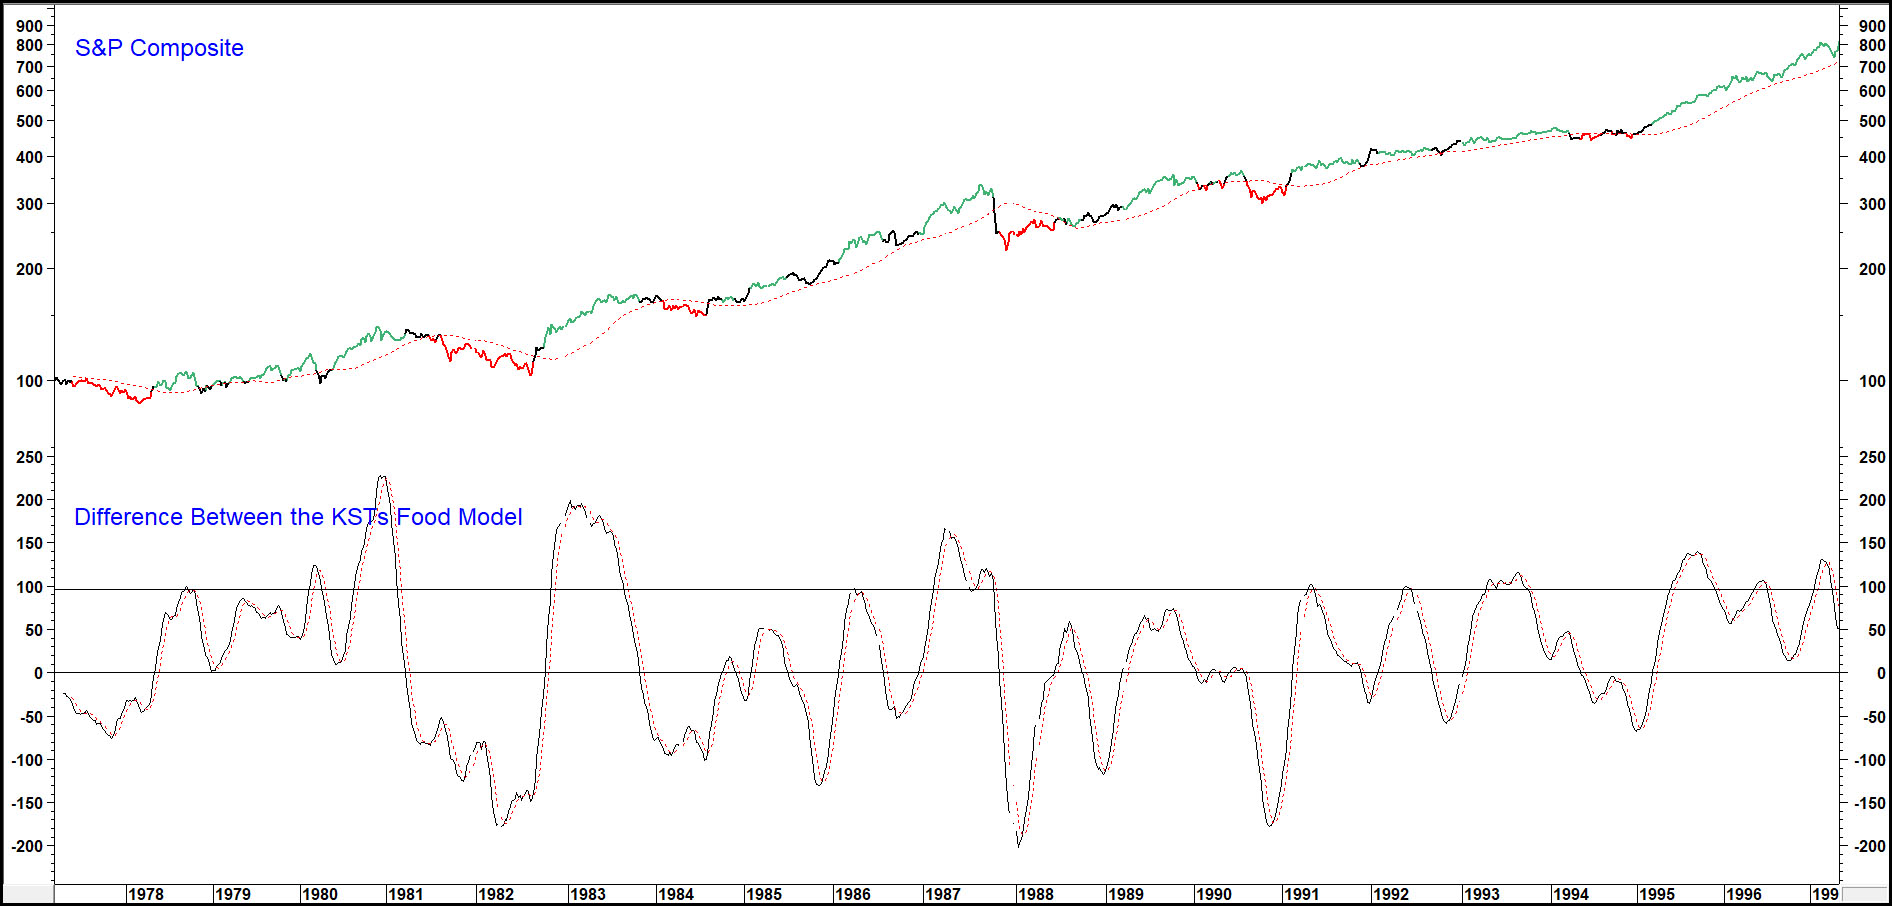
A review of Charts 2 and 3 shows that the model would have sidestepped all major declines except the 1987 crash. However, a small weakness lies in the fact that it has a habit of going bearish right at the end of a small decline, such as the 2010 sell-off.