
Setting protective stops is an essential ingredient in any leveraged trading activity. This process can either be done physically, by actually placing them in advance with your broker, or you can decide mentally where a stop should be executed. If a stop is placed physically, it may involve setting an alert with your software and watching the price action very closely. On the other hand, if you set the stop mentally, you may be focusing on one specific market, and can immediately execute an order the moment the stop is reached. It does not really matter. The advantage of having the stop in the market is that it will be executed immediately, and there is no second-guessing. The disadvantage of a physical stop is that market makers can see your stops and may try to “go” for them.
The disadvantage of placing a mental stop is that you may change your mind for the wrong reason when the price reaches that particular level. This could be induced by fear of taking a loss, or just wanting to give the price a little more room. For either reason, the change of mind is triggered under the duress of market action rather than objective thinking. Unless you are sure this will not happen and that you will stick to your guns, the mental stop approach is not advisable. Whichever method you use, the important point is to make sure, when you enter a trade, you know exactly where you are going to get out if things go against you. As time progresses and prices change, the level of the stop is also altered. If you are trading more than one contract, or several hundred shares, there is no reason why you cannot split the stop at different price levels. After all, we are dealing with probabilities, and if the probabilities are not so great, exposure should be less.
There are several advantages to placing stops. First, by the very nature of establishing a stop level that is either physically or mentally entered, you are going through the mental process of preparing yourself for the worst. In the case of profit-taking stops, it will be a mental preparation of an optimistic outcome. Quite often, when prices go against you, your emotions become clouded, making an objective decision harder to accomplish.
Placing the stop helps to overcome this problem since the decision to do so will be made when your mind is more equally balanced. If prices move sharply in your direction, it is often accompanied by good news, so good in fact that it is easy to fall into the trap of believing that the price will continue to trend forever. That, unfortunately, is often the point when the price will reach an extreme.
Another advantage is that a correctly placed stop will usually get you out at a better price than just throwing in a market order. This is because a stop order is executed as a market order, once the stipulated price has been touched. If you are just watching the market and suddenly decide to stop yourself out, it is quite possible that the time delay will result in a far worse fill. My comments here assume that the stop is executed in a reasonably orderly market. In some instances, when dramatic news such as an unexpected economic report breaks, there is literally no liquidity even in the most “liquid” markets. In such an environment, orders can be executed at levels that would emit four letter words from even the most docile traders.
Chart 13.1 — December 1997 Corn 10-minute Bar 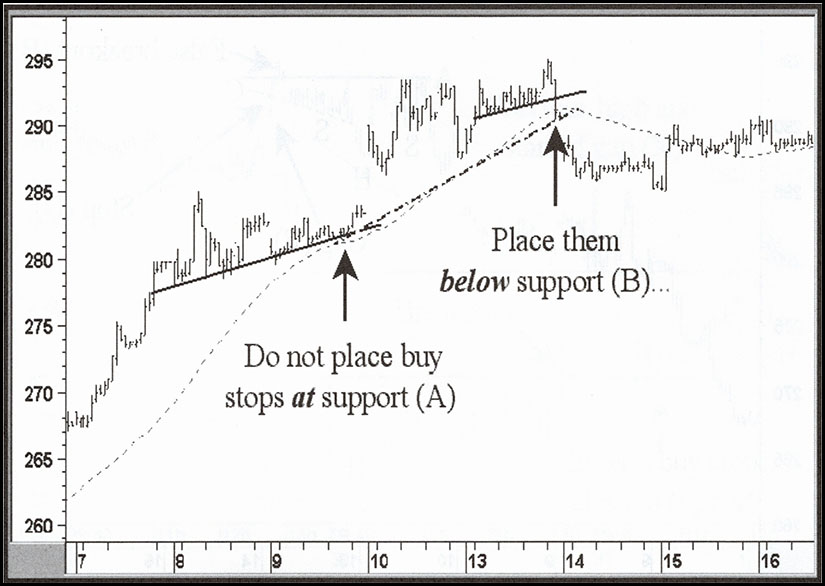
Placing Stops
With long positions, the best and most obvious point to place a sell stop is just below support, or for covering a short position above resistance. The terms support and resistance in this sense, can mean a lot of things. Support, in reference to stops for instance, may develop at a specified price level. Alternatively, it could be dynamic in the sense of a trendline or moving average acting as a support level. The key is to place a stop just below support not at it. After all, if the price does not slip below a support level, or rise above a resistance level, the trend is not reconfirmed or reversed, depending on the circumstances.
Chart 13.1 features a 45-period moving average and the bars are 10 minutes in length for the corn contract. It features an example of a top forming. Had we placed the stop at the trendline; i.e., at support, it would have been triggered and the trade would not have gone on to make a good profit. Far better to place it below support as indicted by line (B) and the moving average, since the two re-enforce themselves as support areas. Signals, as a result of a trendline and moving average violation, are generally far more significant than those that only penetrate one of them. Buy stops should be placed above resistance.
Chart 13.2 — December 1997 Corn 10-minute Bar
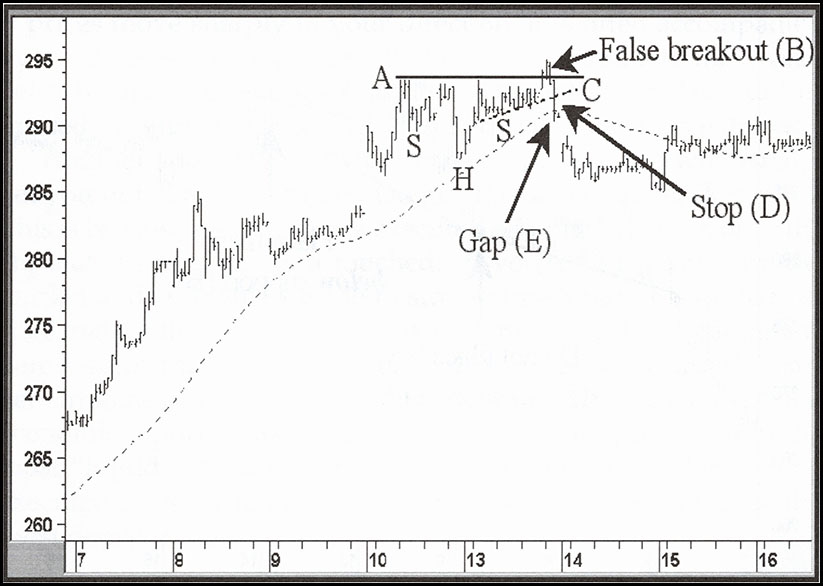
In Chart 13.2 we see a resistance trendline (A), which is really a neckline of a consolidation reverse head and shoulders. This would, subject to the agreement of our momentum analysis, be a legitimate place to make a purchase. However, within 20 minutes the price broke down again, as the breakout was false (B). We would have expected the neckline to hold, since it has now reversed its role to support following the breakout. Its penetration was the first sign of trouble. However, once the price slipped below the trendline joining the lows forming the right shoulder (C), it was the signal to liquidate. As you can see, the bar, during which this took place, started 20 minutes before the session close. The damage was pretty well done in 10 minutes. Consequently, there was not a lot of time to react. It would have been far better to place the stop just below the trendline (D) (support) in advance, because by the time the bar ended the price was also below the moving average. The next day, of course, it gapped down at the opening (E).
Chart 13.3 — December 1997 Corn 10-minute Bar
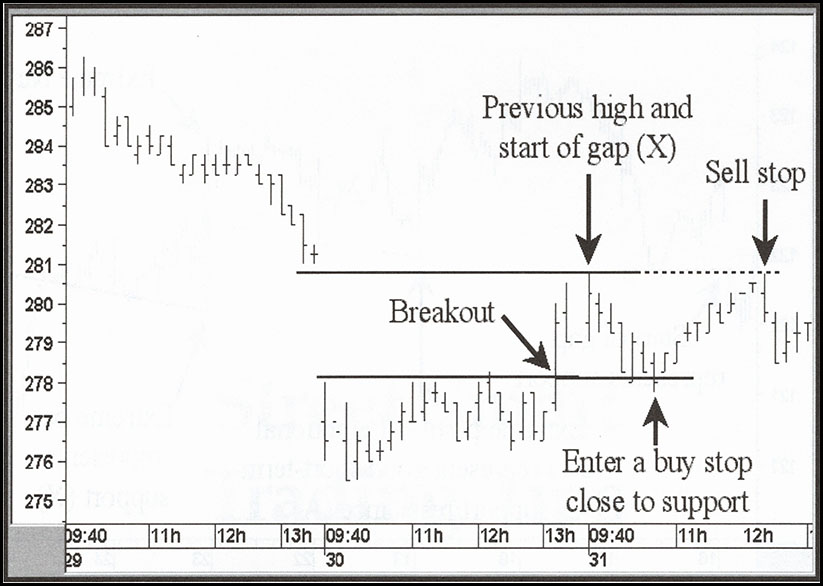
Timely stops can also be placed for getting into positions following breakouts. Chart 13.3 features a breakout, which is quickly followed by a pullback. The retracement takes it right back to the breakout level. This was previously a point of resistance, but now reverses its role to support. Consequently, it would have made sense to place a buy stop as the price was falling back to that support level. If the support was seriously violated, then the position could have been quickly liquidated for a nominal loss.
Chart 13.3 also offers an example of a good place to exit a position, or part of a position, by placing a stop at the previous high. (This is the lower end at where the 13:30 gap formed on the 29th and this also represents resistance.) Let us say we had been lucky enough to go short at (X). Just above this level would have represented a great point to place a stop from the point of view of covering the position. As it turned out, the price never broke above this resistance, so the short position ended the chart with a small profit.
EXCERPTED FROM “Technician’s Guide to Day Trading”
Related Article: Managing Losses