
*Please note that the charts were taken from a July 2000 article and 1 & 2 could not be replicated, so original scanned charts were used.
Most all the indicators used in technical analysis are based on pricing data. We either use prices themselves, a statistical manipulation with moving averages, or oscillators, etc. Volume though, is an independent variable and can be extremely useful in confirming price action. There are many ways of using volume, such as the construction of oscillators, on balance volume lines and designing indicators using both volume and price. Some of these more sophisticated variations will be discussed in future articles. In this one, though, I’m going to concentrate on the basics.
First, it’s important to understand there’s always a perfect balance between buyers and sellers because the amount of a security sold is always identical to that which is purchased. What moves pieces is the relative enthusiasm of buyers or sellers. If sellers are more motivated than buyers, the price will decline and vice versa.
Volume is usually displayed in charts as a series of histograms underneath the price. This is a useful form of presentation since it reflects expansions and contractions in activity. There are several key principles used in interpreting volume. However, before I cover this aspect, it’s important to understand that when I talk about changes in the level of volume, I am referring to volume changes relative to the recent past. For example, it’s not possible to compare the volume on the NYSE today when it’s in the hundreds of millions with the volume at the start of the century when it was less than one million. This is because there are now far more shares listed. Activity has also grown because of futures and options arbitrage, and reduced commission charges allow more frequent trading. But you can compare high volume this week with volume two weeks ago. The following represents a brief synopsis of some of the basic principles of volume interpretation:
Volume Should Go with the Trend
When prices are rising it is normal for volume to expand, and when prices are declining volume typically contracts as in Figure 1.
Figure 1 — Expanding Volume on Rallies is Bullish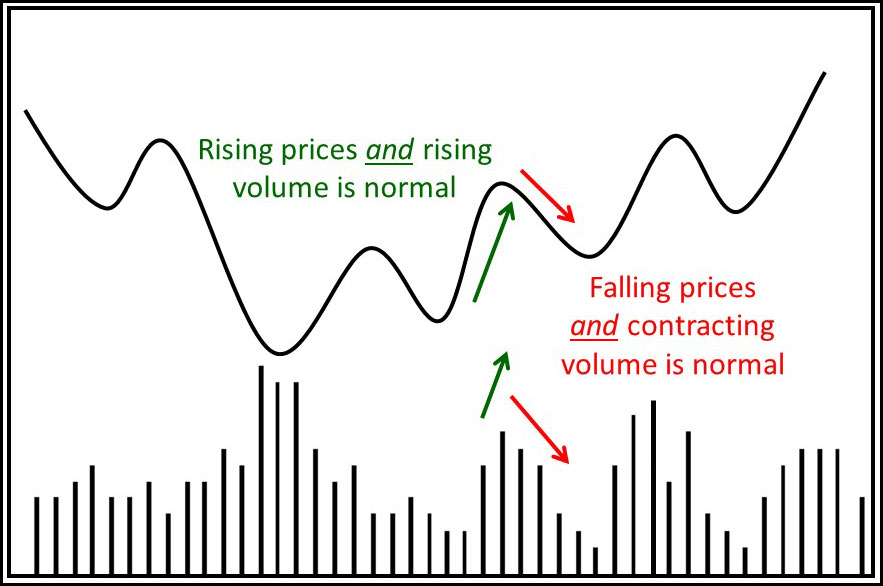
Figure 2 reveals that when we talk of rising or contracting volume, we mean the overall trend of volume, not individual sessions. The green arrows mark the trend, which is an expanding one. Within that trend though, there are individual sessions such the two flagged by the red arrows, where volume is below the surrounding days. When prices are rising and volume is expanding, market action is not telling us much except to say that this is a normal state of affairs and that the uptrend is soundly based.
Figure 2 — Trends are Not One Way Affairs

However, when prices rise as in Chart 1 featuring the Mexico Fund, and the trend of volume is down, it’s abnormal and warns us that rising prices are being fueled more by a lack of selling than the enthusiasm of new and aggressive buyers.
Chart 1 — Mexico Fund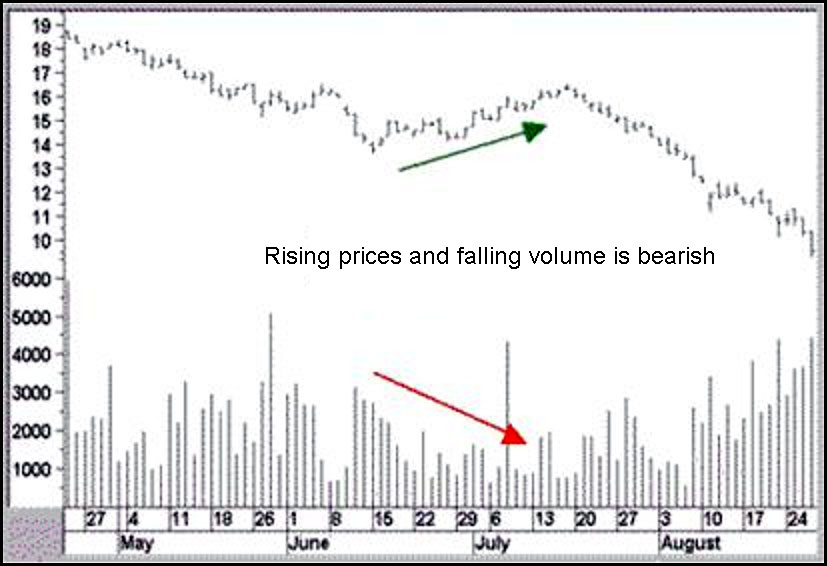
Most of the time you’ll find bear market rallies being associated with a trend of declining volume, such as that shown in Figure 3, where volume contracts as the short-term bear market rally develops. Just as falling volume and rising prices are abnormal, so are declining prices and expanding volume. In a healthy market, prices and volume contract together, more because of a lack of buying than a preponderance of selling. However, when prices decline and volume expands, it tells us that downside pressure is present because sellers are very aggressive, and this isn’t a good portent for future prices.
Figure 3 — Contracting Volume on Rallies is Bearish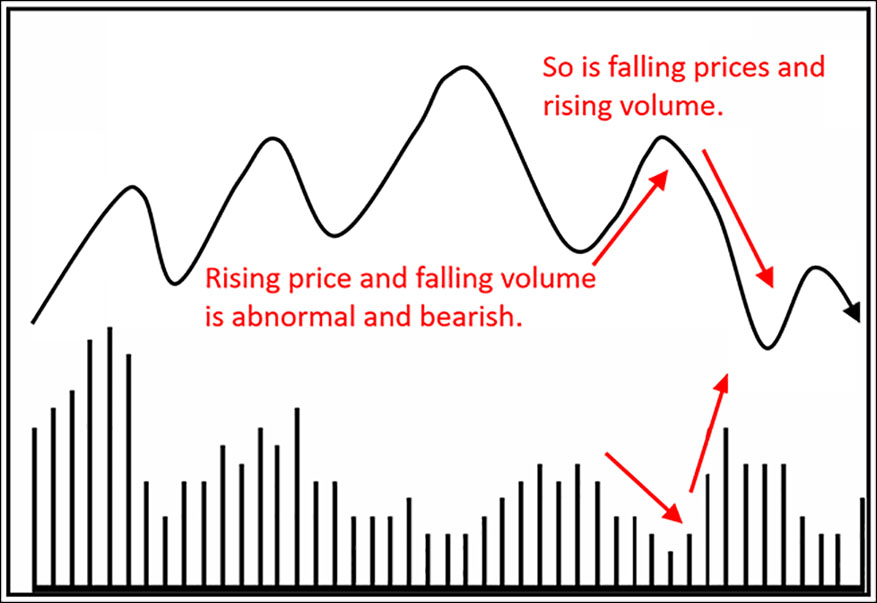
Chart 2 — Nucor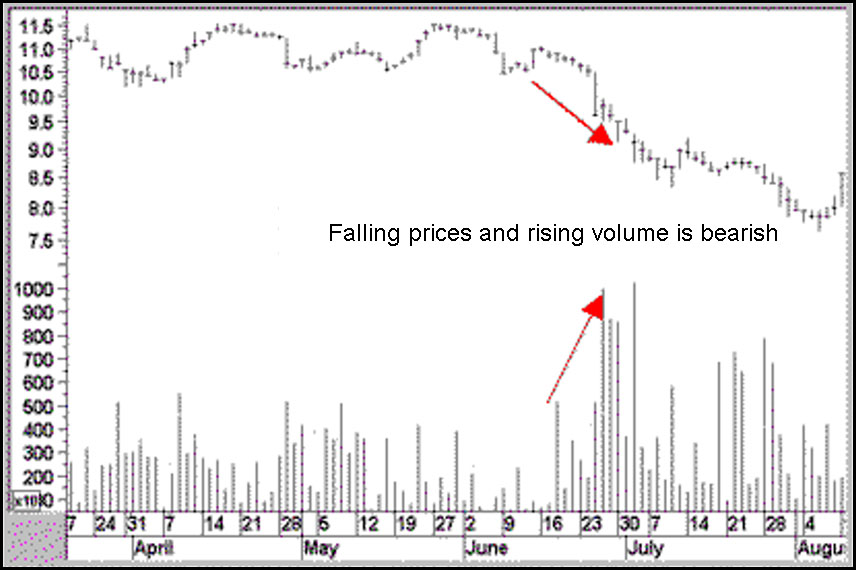
Volume Leads Price During Rallies
It’s normal for a peak in prices to be preceded by a peak in volume. You can see in Figure 4 that the volume peaks at A but the price tops out at C. The level of volume at C is less than that at A and B. At point B, a negative divergence between price and volume developed as prices moved higher and the peak in volume moved lower. This type of action tells us that prices are no longer being supported by an influx of enthusiastic buyers and that the prevailing trend is suspect.
Figure 4 — Rising Prices Need Expanding Volume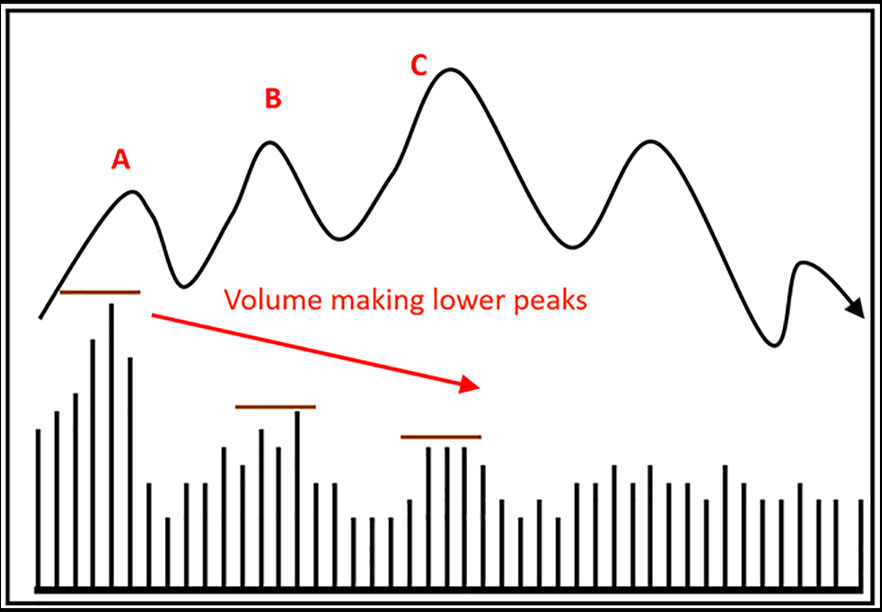
Chart 3 of IBM displays two interpretive principles. First, we see the concept of volume leading price. Secondly, note how volume expands noticeably on the first two days of the decline. This, as discussed above, is abnormal because volume isn’t going with the trend and is therefore a bearish sign.
Chart 3 — IBM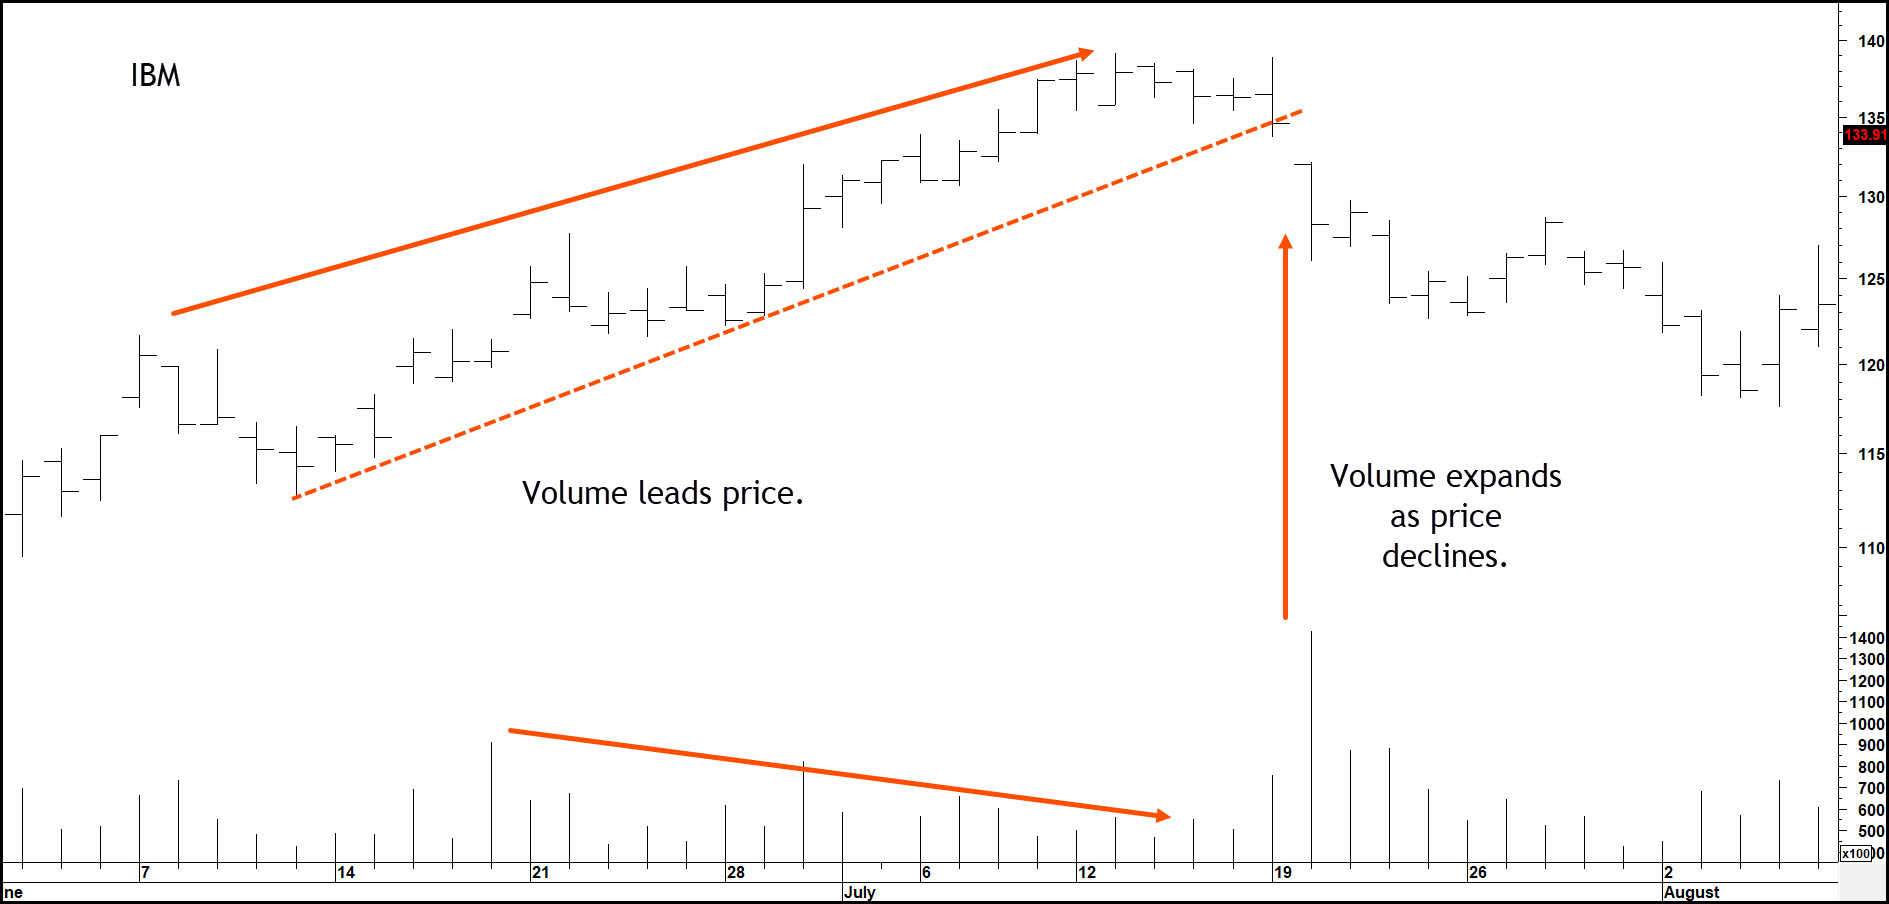
Excerpted from “Lesson 3 – Volume Characteristics, PringU”
Related Article: Volume Basics Part 2