
Dramatically Expanding Volume Following a Decline Represents a Selling Climax, which is Generally Bullish
Figure 5 shows a market where the price declines for a while and then reverses as volume expands significantly. This is called a selling climax and represents a cleaning up of overhead supply. Such declines are typically triggered by bad news, prompting weak and uninformed holders to sell at any available price. Once the price has been marked down sufficiently, more informed buyers who are able to look through the bad news begin to pick up this surplus supply, and the price then reverses to the upside. Selling climaxes either represent the bottom or are followed by a rally and a subsequent move to a new low. In either case though, the bottom marked by the selling climax usually holds for a considerable time. What represents “a considerable time” depends on the time span of the chart. Clearly, a selling climax on an intraday chart will be nowhere near as powerful as a selling climax on a monthly chart and so forth.
Since the selling attracts a huge amount of volume, it’s natural that the subsequent rally will be accompanied by declining volume. This is one of the few instances where rising prices on low volume is actually a bullish factor.
Figure 5 — Selling Climax is Bullish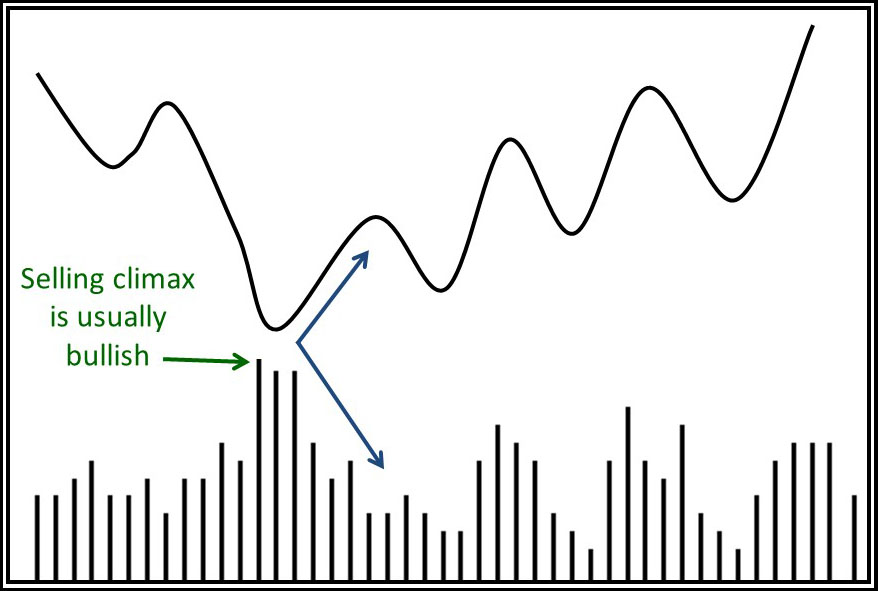
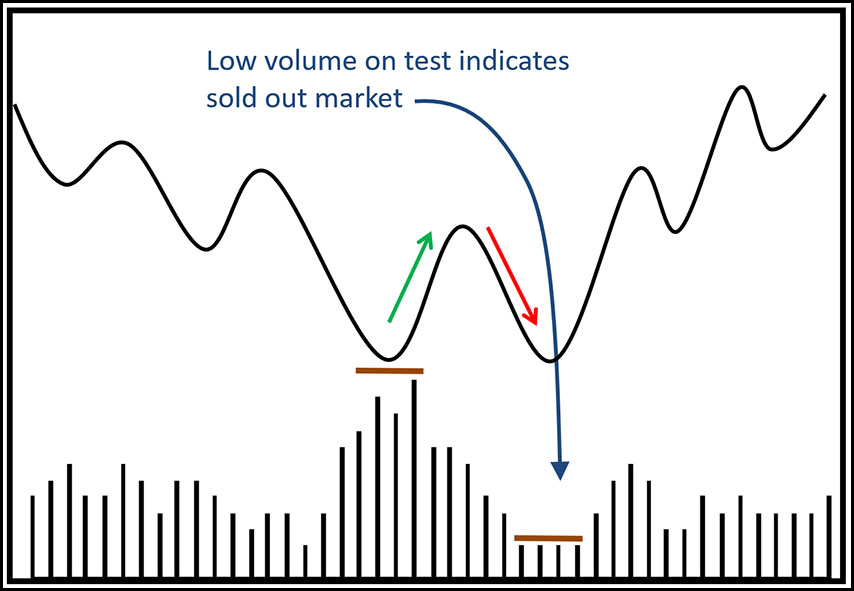
Figure 6 shows that the rally following a selling climax is often followed by a test of the selling climax low. The tip-off that the test will be successful can be seen from the fact that volume dries up to almost nothing, indicating a distinct lack of interest and compares to the tremendous excitement at the previous low. The lack of interest at the second bottom typifies a very fine balance between buyers and sellers. Consequently, when the rally starts, it usually represents the early stages of a major move.
Figure 6 — Look for Low Volume When Testing Lows
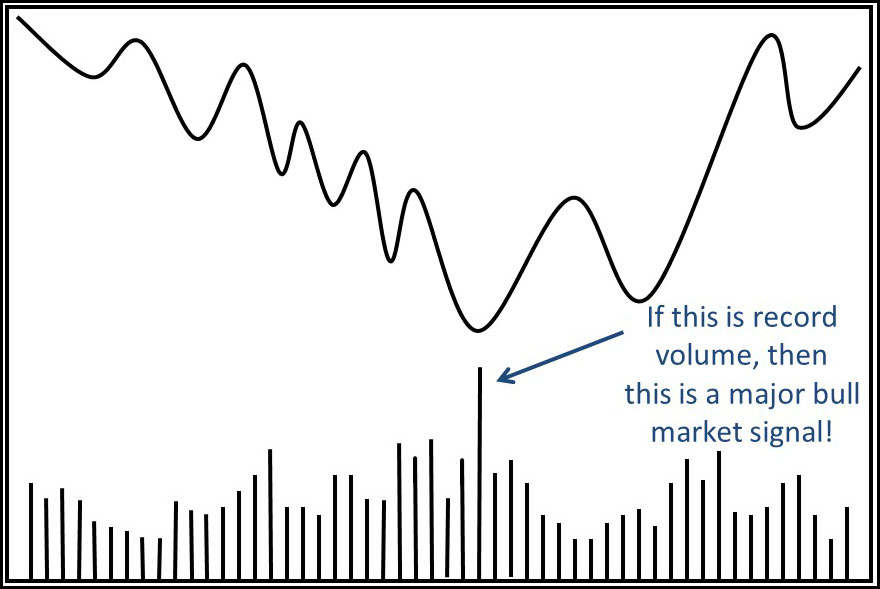
Record Volume Coming Off an Important Low is Usually a Precursor of a Major Rally
Figure 7 shows a rally taking place after a major decline. However, the volume expands to a record level. This type of action is almost always a tip-off that a complete reversal in market sentiment is underway. Examples that come to mind are record volume for the NYSE coming off the 1982 and 1984 bear market lows, and the intermediate low of October 1998. The same thing happened for bond futures in October of 1998. This type of market action does not happen very often, but when it does, it should never be dismissed lightly.
Figure 7 — Record Volume is Usually Bullish
A Parabolic Move in Price and Volume is Bearish
In the final figure (Figure 8) we see a parabolic rally in both price and volume. Such action typically indicates exhaustion once it has run its course. In such instances it’s normal for price and volume to reverse simultaneously at the same kind of speed that was associated with the end of the previous advance.
Figure 8 — Parabolic Blowoff is Bullish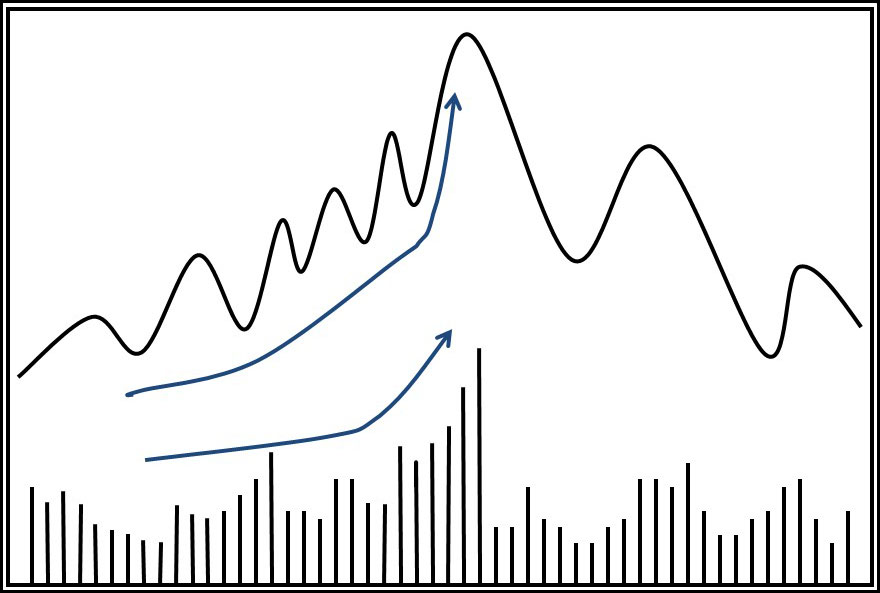
In Summary:
1. Volume is measured in trends and the trends are always interpreted in relation to the recent past.
2. It’s normal for volume to expand with rising prices and contract with declining ones. Anything to the contrary is abnormal and warns of an impending trend reversal.
3. During bullish trends, it’s normal for volume to lead price.
4. Selling climaxes clear the air. They don’t necessarily signal the final low for the move but are almost always followed by a rally.
5. Record volume coming off an important low usually signals a strong rally.
Excerpted from “Lesson 3 – Volume Characteristics, PringU”
Related Article: Volume Basics Part 1