
It’s a fact that prices rarely move in a straight line. Rather, they form a steady pattern of rising peaks and troughs in an uptrend and declining peaks and troughs in a downtrend. This principal building block of technical analysis appears to be especially true for intraday charts and is well worth considering as a legitimate technique for day trading.
Figure 1 shows a series of rising peaks and troughs—a normal uptrend. It becomes apparent at point (A) that the latest peak is lower than its predecessor. Thus, the series of rising peaks is no longer intact, but the series of rising troughs is. It is not until the price breaks below the previous low at (B), that a series of declining peaks and troughs is signaled.
Figure 1 — Normal Uptrend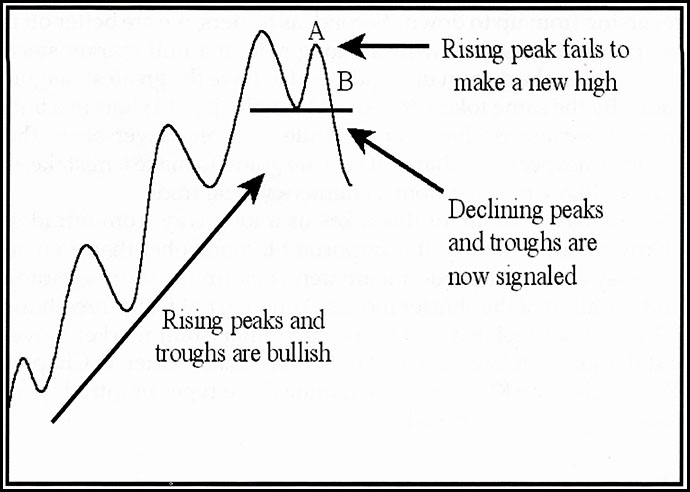
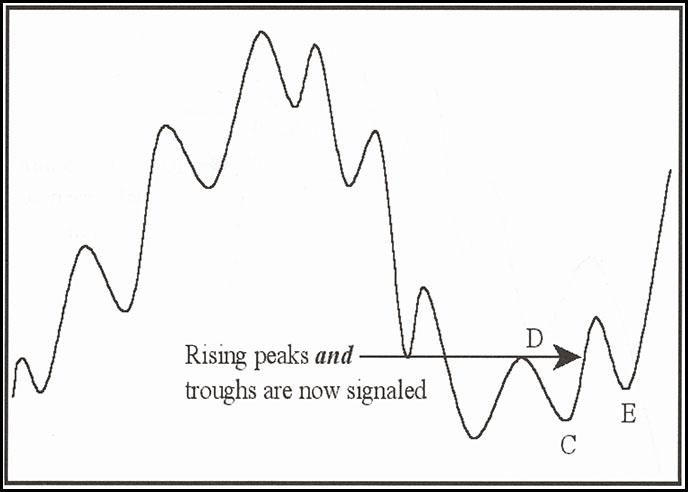
Figure 2 shows a declining market, where the process is reversed. The price fails to take out the final low at point (C). This indicates that a reversal may be underway, but an actual trend reversal signal is not triggered until it subsequently rallies above the previous high at point (D). Since this is a peak/trough progression, it should not be surprising that the price falls below (D) again. However, as long as it remains above the previous trough the rising trend of peaks and troughs is still intact, and the trend continues to be classified as bullish.
Figure 2 — Declining Market
EXCERPTED FROM “Technician’s Guide to Day Trading”
Related Article: Support and Resistance