
Two terms you hear a lot about are support and resistance. Basically, they’re points on a chart where the probabilities favor at least a temporary halt in the prevailing trend. For example, if prices are declining and reach support as in Figure 1, they can be expected to bounce. The rally may be temporary as at point A, or may even mark the low point for the whole move as at point B.
Figure 1 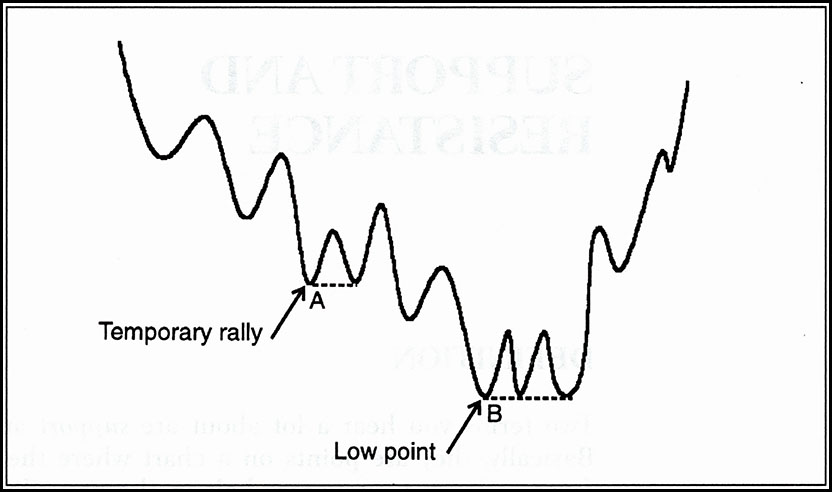
In their classic book Technical Analysis of Stock Trends, Edwards and Magee define support as, “buying, actual or potential, sufficient in volume to halt a downtrend in prices for an appreciable period.” While we’re on the subject of definitions, resistance is selling, actual or potential, sufficient in volume to satisfy all bids and hence stop prices going higher for a time.
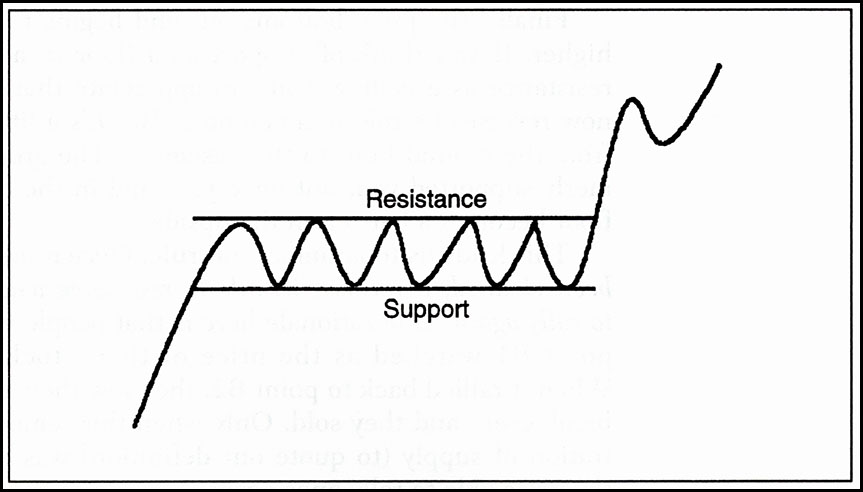
Think of resistance as a temporary ceiling and support as a temporary floor, as illustrated in Figure 2. In order to become a floor, a support area must represent a concentration of demand. I emphasize the word concentration because supply and demand, by definition, are always in balance. At whatever price a stock trades, there will always be the same amount bought as is sold. It’s the relative concentration or enthusiasm of either buyers or sellers that determines the price level. A support area then is one in which sellers become less enthusiastic or less willing to part with their assets and buyers, at least temporarily, are more strongly motivated.
Often support and resistance area occur at round numbers. For the Dow in the 1970s, it was 1000. Every time the Dow came up against that psychologically important number, sellers became more enthusiastic and prices declined. For gold in the mid-1980s and 1990s, the magic number has been $400.
Figure 2
General Rules —
I’m sure you’re now asking the question, “How do I know how important each support and resistance level is likely to be?” Unfortunately, I can’t answer that question precisely, but I can offer some general rules to help.
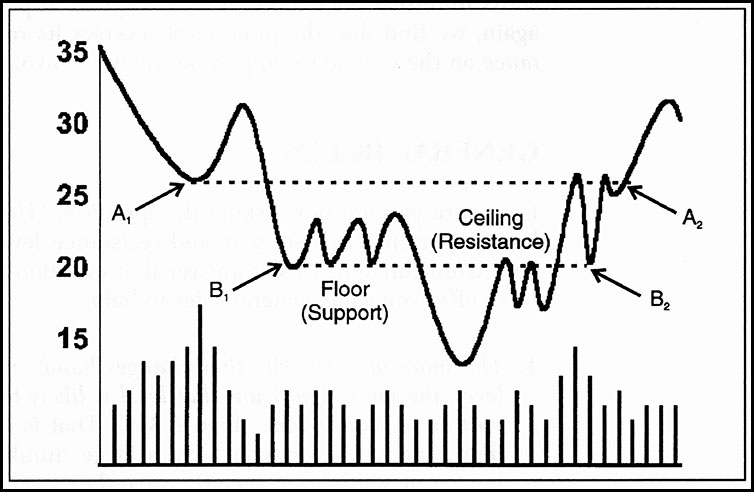
The more of a security that changes hands at a particular level, the more significant that level is likely to be as a support or resistance zone (Figure 3)
That’s fairly self-evident, for whenever you have a large number of people buying and selling at a specific price, they tend to remember their own experiences. Buyers like to break even after suffering a loss. Sellers, on the other hand, may have bought lower down and now recall that prices previously stalled at the resistance area. Therefore, their motivation for taking profits is that much greater.
Figure 3
The Greater the Speed of the Preceding Price Movement, the More Significant a Support or Resistance Zone is Likely to Be
Just think of trying to lift a heavy weight. If you make the attempt after running a fast race, you are less likely to succeed than someone who has not made such a dash. Markets are the same way. A modest support or resistance barrier (Figure 4) is likely to be much more significant if prices have been racing ahead or declining sharply than if prices are reached after a slow, steady advance or decline.
The More Powerful the Move Preceding the Support or Resistance Zone, the Greater its Potential as a Barrier
This may seem to contradict the previous rule, but it doesn’t. It’s important to make a distinction between a speedy and lengthy move and a powerful one (Figure 5). Remember our analogy to lifting a weight after running a fast race? Well, if the lifter is normal, the rule still stands. However, if an Olympic athlete has just run the race, lifting the weight will be a piece of cake. It works the same way in the marketplace. An area of resistance, for example, will quickly fail if the previous move is associated with a huge expansion of volume and momentum. If there’s a lot of power behind a move, the support or resistance zone is much more likely to fail on the first attempt.
Figure 4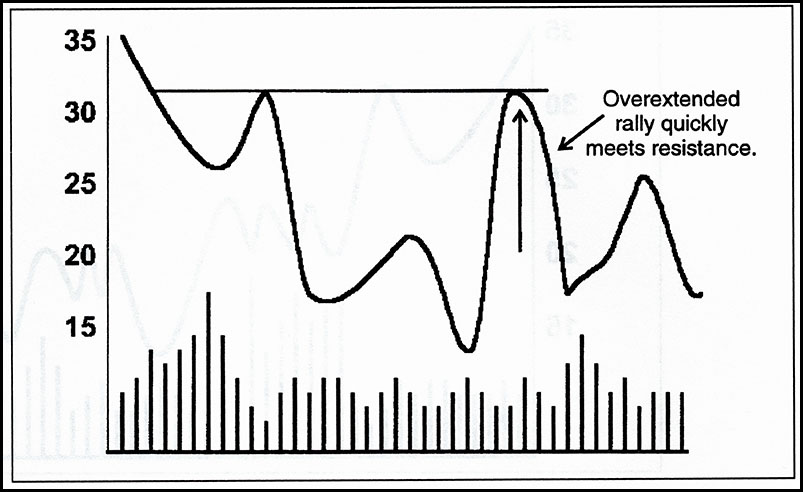
The More Times a Support or Resistance Zone has been able to Halt or Reverse a Price Trend in the Past, the Greater its Significance is Likely to Be
Recall the example of a building. The more times a floor is pounced on, but doesn’t give way, the greater the implication when the floor finally does give way. This is probably the single most important rule we have for estimating the potential importance of a support or resistance area. Just think again of the Dow Jones Industrial Average. From 1966 to 1982, 1000 was the barrier to beat. It had been touched on several occasions, but never decisively breached. Once 1000 was bettered, the move to 2, 3, 4, and 5000 came relatively easily.
The longer the period that has elapsed between the time a support or resistance zone was last challenged, the less significance it is likely to have.
This means that a supply which is six months old is likely to have greater potency than one established 10 or 20 years ago. Even so, it’s almost uncanny how support and resistance levels can repeat their effectiveness time and time again, even when separated by many years.
Figure 5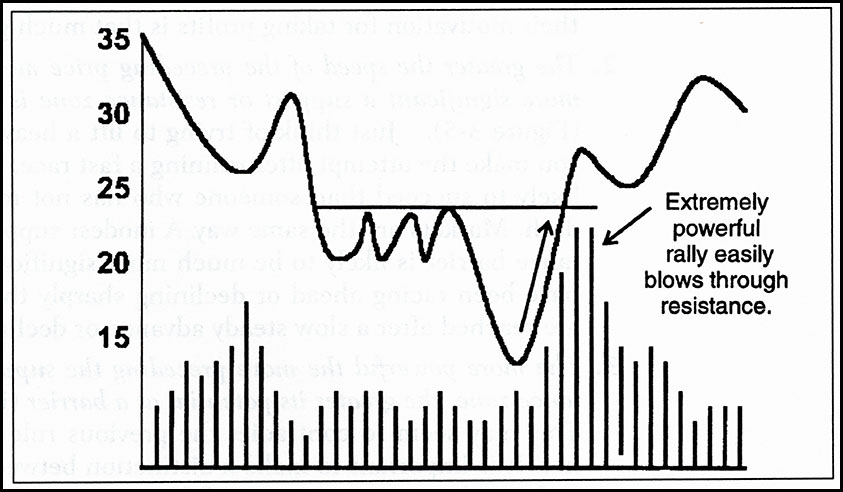
EXCERPTED FROM “Introduction to Technical Analysis”
Related Article: Peak and Trough Analysis