
Introduction
I have often thought it would be great to be able to develop an indicator that could be used for simultaneously analyzing the direction of both the primary (9 months to 2 years) and short-term trends (2 to 6 weeks). Part of the reason is that research shows if things are going to go wrong in your trading life, it will usually happen when you position yourself against the direction of the primary trend. That means using short-term sell signals in a bull market to go short, or short-term buy signals in a bear market to go long, is not the way to go.
My inspiration for this indicator came from two sources. First, the noted economist Joseph Schumpeter published a famous a diagram, in which he combined three economic cycles into one series and used that as his guidance for timing the long wave. The cycles in this case were the Kitchen, Juglar and Kondratieff. The second was my friend, the late Ian Notley, who drew my attention to a schematic diagram that reflected the primary, intermediate and short-term trends so familiar to us in the financial markets. He called this his “market cycle model”, a version of which is shown in Figure 1. I found that an alternative method to charting these three curves separately is to combine them into one indicator, just like Schumpeter’s concept for economic cycles. I call it the Special K because the three indicators I used were the short, intermediate and long-term KSTs. If you’re not up to speed with the KST concept, just think of these as three smoothed indicators like the stochastic based on different time frames.
Figure 1 — THE MARKET CYCLE MODEL
The result is true summed cyclicality, where proxies for the short- intermediate and long-term trends are all combined into one super one, effectively the brown dashed line in Figure 1. Table 1 shows how the calculation is made. The numbers represent days. The daily KST formula is added to that of the intermediate and long-term series. Each indicator is color coded. Thus, red is the calculation for the short-term KST, blue for intermediate and green for the long-term or primary trend. The Special K can be plotted on the StockCharts.com platform as well as the MetaStock charting package.
Table 1 — Special K Formula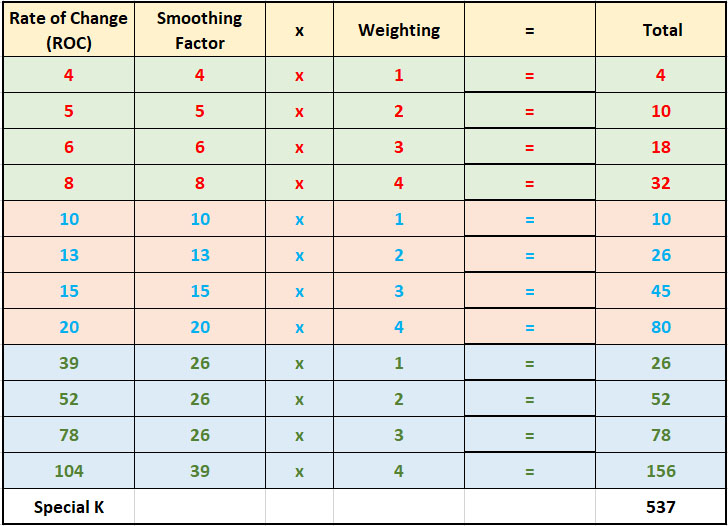
Special K Characteristics
- It’s a curve that reflects the dominant long-term smoothed momentum, such as a 6-month average of a 24-month rate of change. However, since it also contains shorter-term parameters, the resulting indicator is not as smooth. That means it lends itself to technical interpretive techniques such as trendline construction, peak and trough analysis, etc.
- Most of the time, I estimate about 70% of the highs and lows of the Special K correspond to within a week or so of the actual primary trend high and low for the price series it’s monitoring. That’s an easy thing to spot with the benefit of hindsight, but what about in real time? The good news is that it’s often possible to identify these turning points soon after they have taken place. The letters in Chart 1, for instance, indicate that turning points in the Special K often coincide with those for the pound. As in all momentum situations, price sometimes lags due to the nature of the momentum calculation. A2 and B2 are examples of this.
Chart 1 — British Pound/Dollar Cross and a Special K Indicator
- The Special K reflects short term price movements. However, because of the summed cyclicality used in its calculation, some perspective on the maturity and direction of the primary trend can be gained.
How to Spot Primary Trend Reversals
The Special K very much lends itself to trendline construction. Usually, when a line greater than 9 months in duration is penetrated, there is a high probability that the primary trend has reversed. The late 2001 and early 2006 buy signals and the early 2005 and late 2007 sell signals in Chart 1 are good examples. In fact, the 2001 and 2005 signals both represent head and shoulder necklines, indicating the Special K is quite capable of forming classic price patterns. Because of the leading characteristics of momentum, it’s also necessary to make sure that the price is responding with some kind of trend confirmation of its own, as demonstrated from all Special K trend breaks in Chart 1.
Peak and trough reversals often show up at primary trend turning points. We see an instance in Chart 2 where the Special K for the S&P experiences a series of declining peaks and troughs between mid-2014 and the start of 2016. Then, in early July of 2017, the Special K confirmed that a series of rising peaks and troughs was underway. The indicator, for the most part, is too jagged to permit consistently reliable MA crossovers, although when these occur along with trendline violations, price pattern completions or peak/trough reversals such as crossovers are usually reliable. The default combination used for the signal line is a 100-day smoothing of a 100-day MA. It’s far from perfect, but I have yet to come up with anything more consistent. In this instance, the peak/trough reversal signal developed more or less simultaneously with the Special K crossing above its MA (signal line).
Chart 2 — S&P Composite and Two Indicators
Using the Special K to Identify Short-term Price Movements
The Special K can also be used in conjunction with the daily short-term KST. One advantage is that we can use the gyrations in the KST to help identify short-term reversals in the Special K. In Chart 2 for example, you can see the overbought and oversold reversals, flagged by the dashed arrows, indicated the likelihood that the Special K would also reverse.
Chart 3 compares the NASDAQ Composite to its Special K between 2009 and 2018. Note that the Special K bottomed with the market in 2009. However, it didn’t top out in 2018, but touched a series of highs in 2011, 2014 and again in 2017. This is a classic example of how a linear uptrend in an expanded business cycle pushes long-term momentum indicators prematurely to the downside. This kind of a thing is very much the exception but does happen from time to time. It’s a weakness common to all long-term smooth momentum series.
Even so, it didn’t stop the triggering of four relatively successful buy and sell signals. The sell combination in late 2018 was followed by a consolidation as prices paused for breath prior to the next phase of the great post 2009 bull market.
Chart 3 — NASDAQ Composite and a Special K Indicator
Conclusion
The Special K is certainly not a perfect indicator, but it does give us perspective on the long-term trend. In many cases, it can be integrated with short-term indicators such as the daily KST to time near-term market movements. You can learn more about this indicator by reading the Daily KST article.
Related Article: Daily KST