
Equity Prices Abhor Unstable Commodity Prices
Gently rising, flat or gently falling commodity prices offer a benign environment in which stocks can flourish. It’s when industrial commodity prices become unstable in either direction for an extended period, that equities are vulnerable to a long-term decline in inflation adjusted prices.
Chart 1 compares real stock prices to a momentum measurement for commodity prices. It supports the idea that rapidly moving commodity prices in either direction are bearish for stocks. The indicator expresses how each monthly level in the commodity index deviates from its 18-month moving average. An unusually high reading indicates when the index is substantially above its 18-month moving average and vice versa. shaded areas indicate unusual commodity volatility. Not all moves in equity prices are explained by this action, but generally speaking, investors should be careful when one of these two conditions are in force.
Chart 1 — Inflation Adjusted Equities versus Commodity Momentum 1900 – 2020
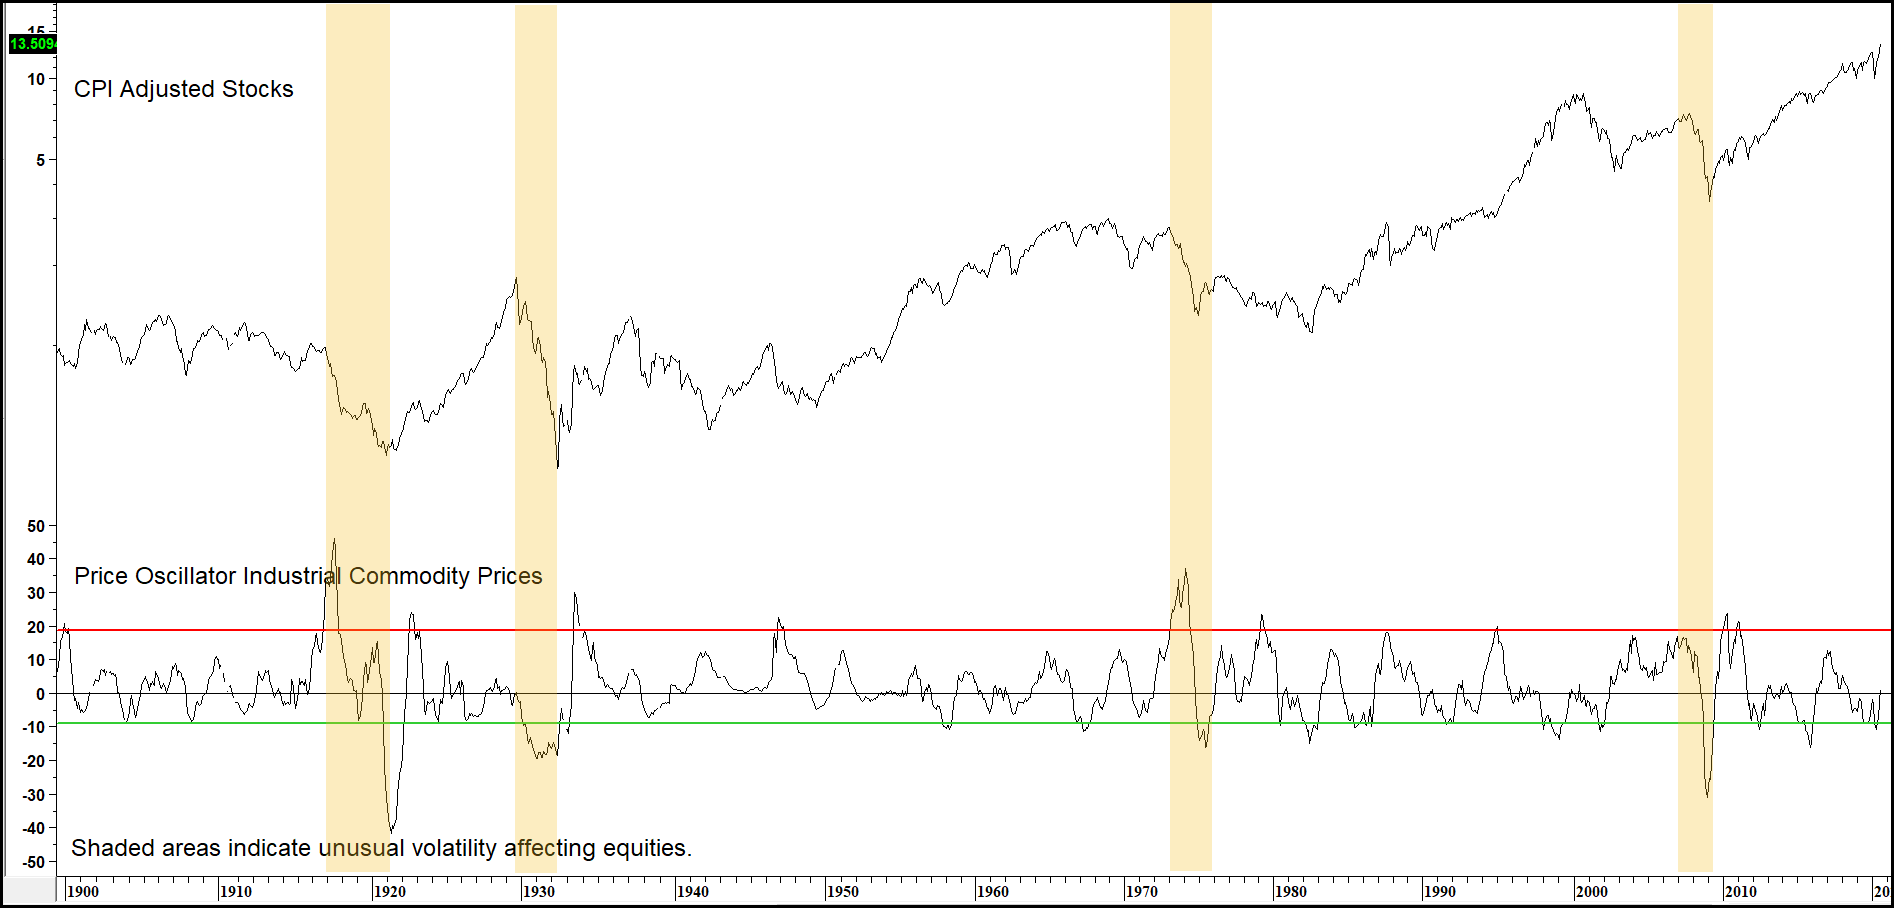
Chart 2 shows that this relationship between commodity momentum and equity prices is helpful in identifying the second stage of a primary bull market in stocks. In this respect, the vertical lines show that equities almost invariably rally following a commodity momentum low. That’s because rising commodities indicate a growing economy. As long as that commodity advance doesn’t get out of hand, that translates into higher profits and stock prices.
Chart 2 — Inflation Adjusted Equities Versus Commodity Momentum 1937-2020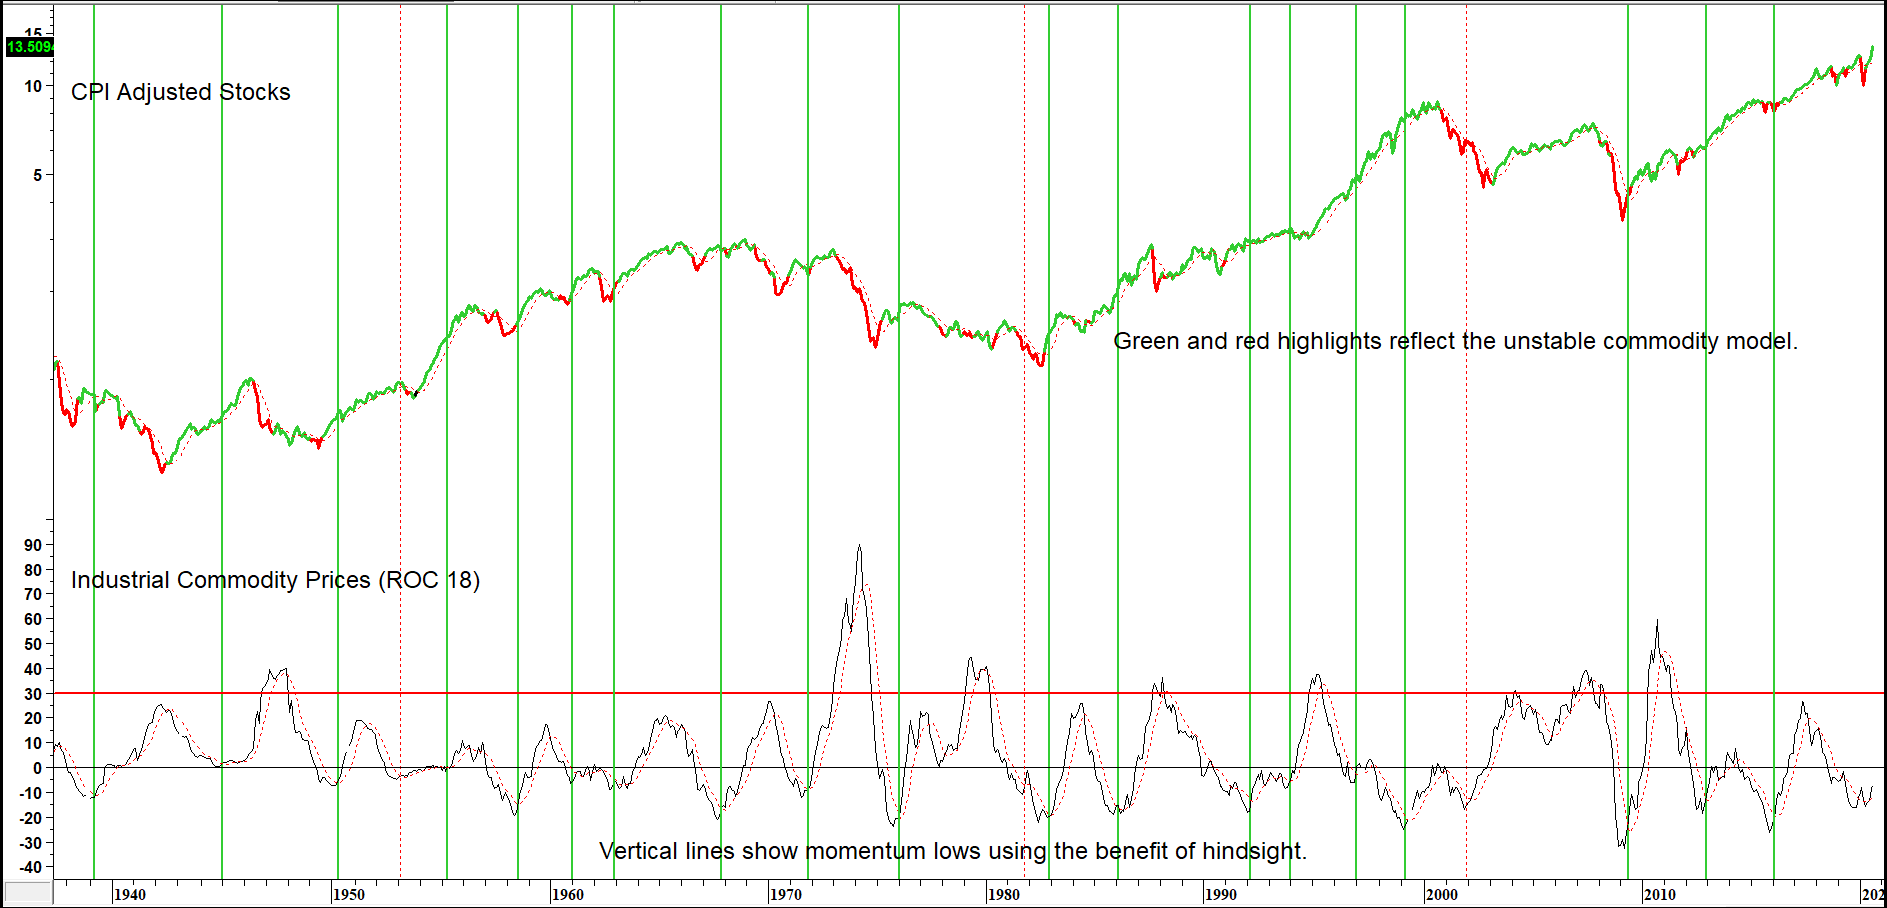
Quantifying Dangerous Commodity Instability
Being aware of these relationships is all very interesting but isn’t much help unless this knowledge can be converted into a more practical actionable technique! The task then becomes one of applying some rules that warn us when the trend of industrial commodity prices has become unstable.
To do that, we take the following three conditions into consideration:
- Dangerous periods of upside commodity volatility (too much inflation).
- Treacherous environments of declining commodity prices (excessive deflation).
- A form of trend measurement that confirms whether equities are responding in a negative way to the defined environment.
The ingredients for the model are featured in Charts 3 through 5. The red highlights indicate when inflationary or deflationary conditions are hostile for equities; green signals the all-clear.
Chart 3 — Real Stock Prices Versus the Commodity/Stock Model 1912 – 1955
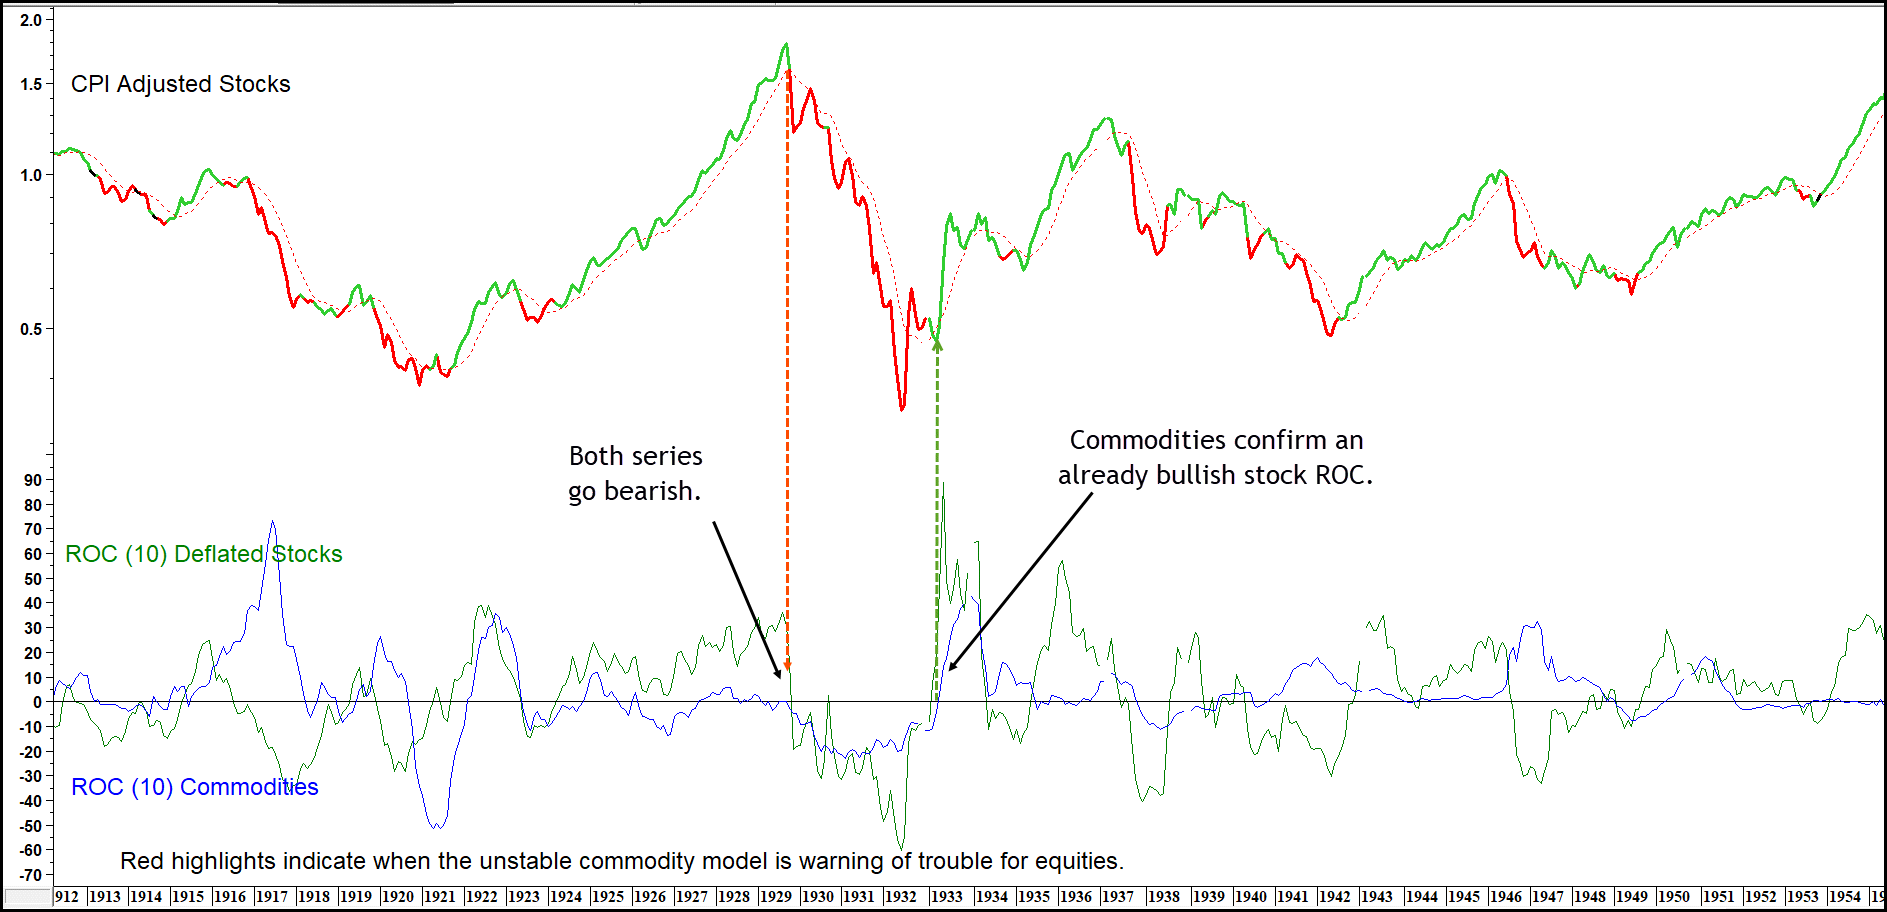
Negative signals for inflation adjusted stocks develop when two of the three conditions are in force. First when the 10-month ROC for deflated equities and commodities are both below zero. In this case, negative commodity momentum indicates a weak economy and the bearish negative equity velocity confirms that stock prices are responding to it. It’s also a way of showing that downside commodity instability is sufficient to have an adverse effect on stocks. If it weren’t, then they would not be experiencing negative momentum.
Chart 4 — Real Stock Prices Versus the Commodity/Stock Model 1947 -2020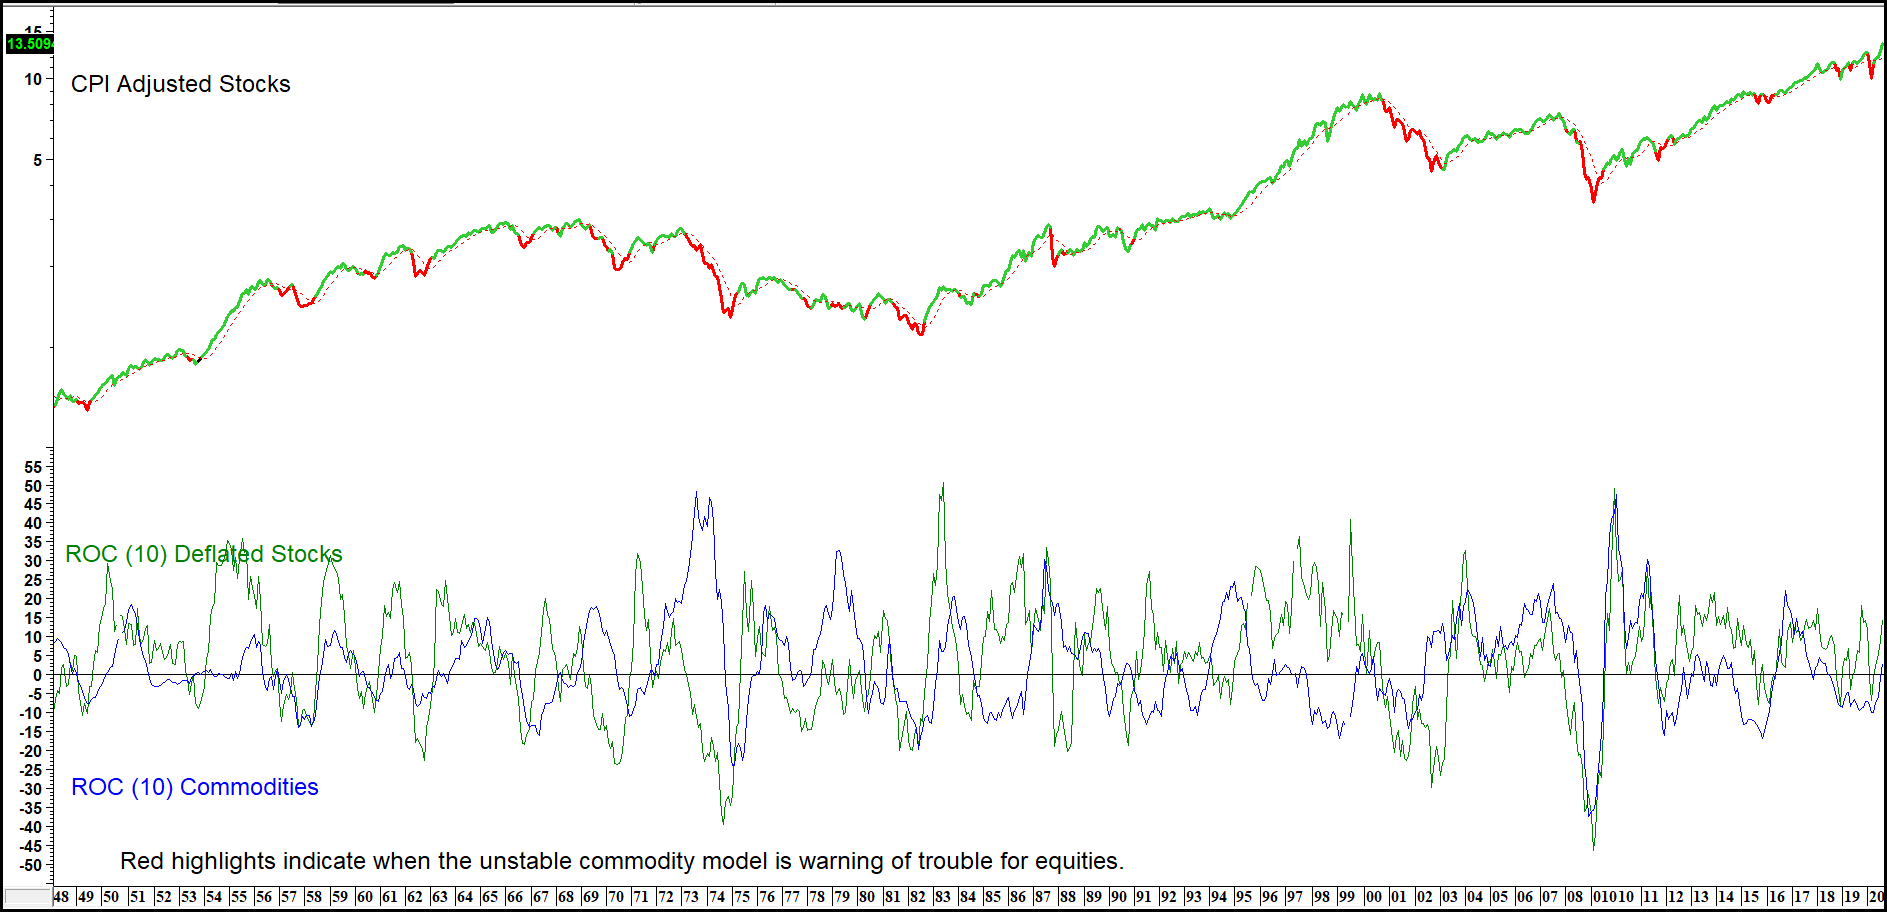
The second condition monitors when upside commodity momentum is excessive, and therefore likely to harm stocks. For example, we know that a gentle rise in commodity prices is positive for equities because it reflects the fact that the economy is growing, but not in an overheated way. However, when commodity prices accelerate to the upside and stocks fail to respond, it’s a signal that equities have started to factor in these inflationary pressures in a negative way. Equities are a forward looking indicator. If they are reluctant to follow commodity prices higher, they are in effect anticipating that these end of cycle pressures will soon push the economy into recession.
An alternative interpretation is to conclude that when commodity prices are rising at an excessive clip, purchasing power is being drained from the rest of the economy, which is negative for growth. Consequently, when the equity market reflects these fears by responding unfavorably, it shows that the message concerning a negative commodity environment is getting through.
Chart 5 — Real Stock prices Versus The Unstable Commodity Model 1909 – 2020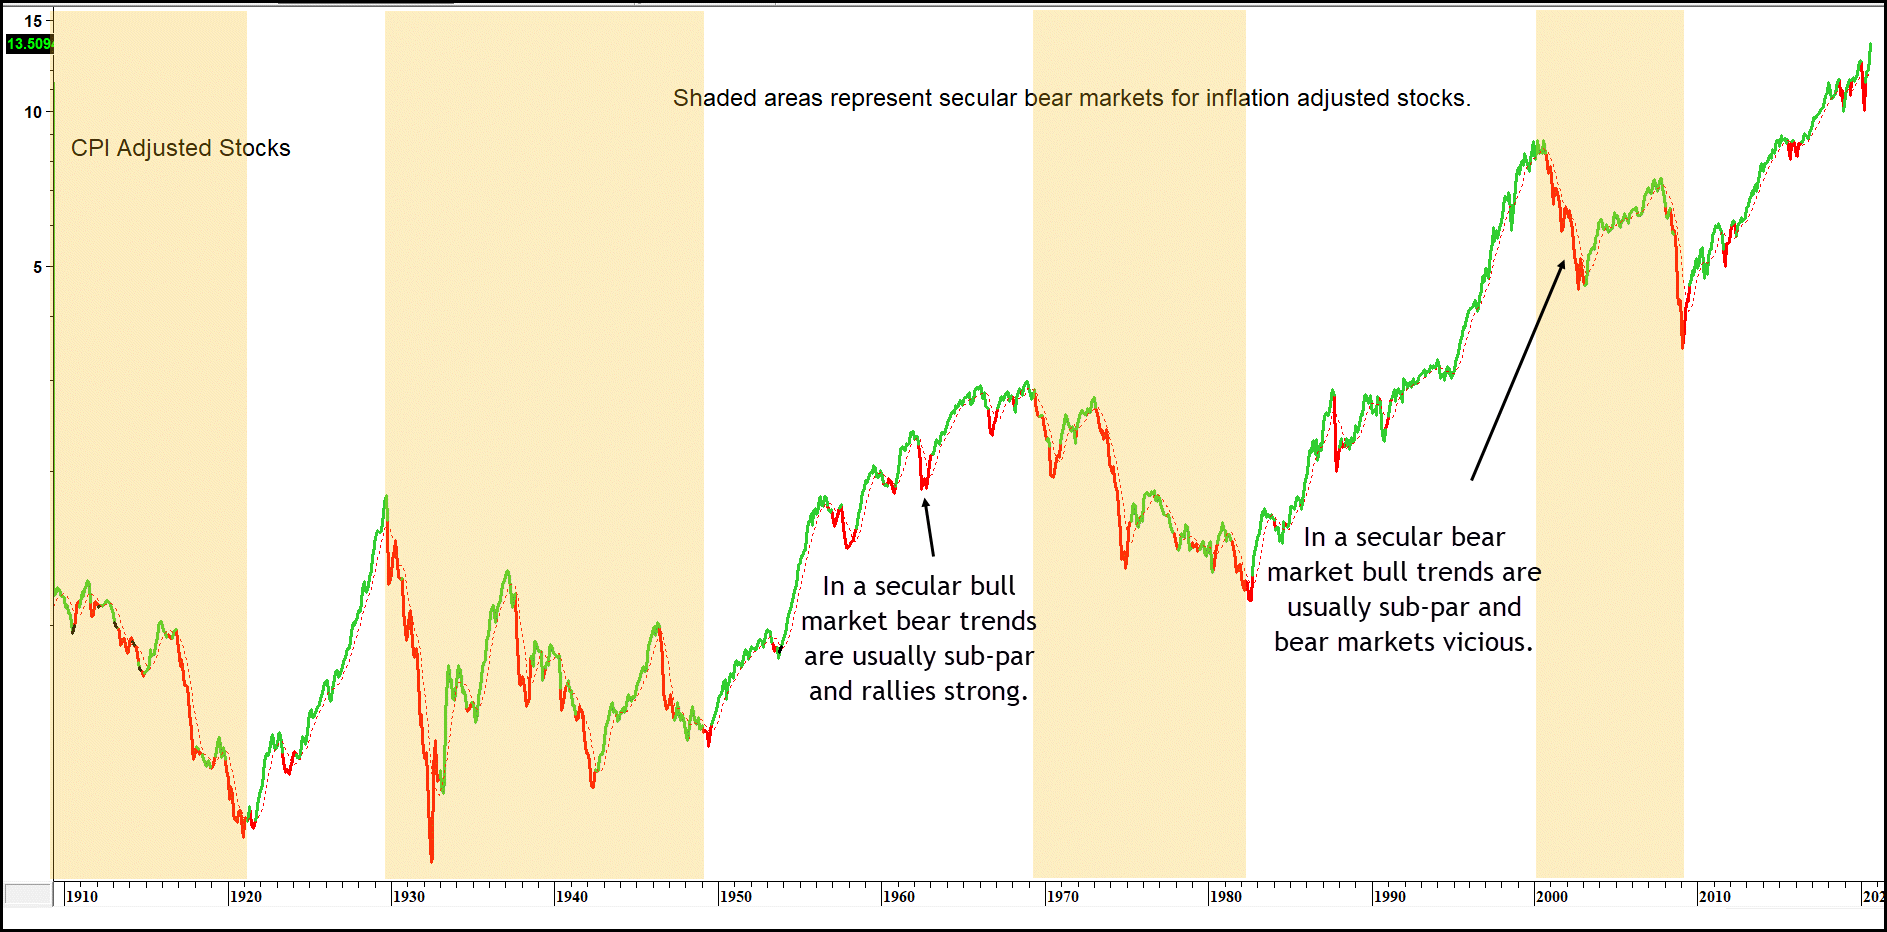
Our model measures this second condition by subtracting a specified rate of change for inflation adjusted equities from that of commodities. When the differential exceeds 21%, the second unstable commodity condition is met. It remains in force until a reading below 21% materializes.
The final model ingredient requires that the deflated stock series confirm the conditions being signaled by its other two components. In other words, if either of the conditions is bearish, then deflated equities would confirm by trading below their 9-month MA.
Related Article: Inflation (Commodity) Barometer