
There are three principal reasons for an investor to allocate assets: to reduce risk through diversification, to allow for the times when a specific asset is attractive and the times when it is not, and to reduce the emotional aspect of decision making by carefully and gradually shifting emphasis from one type of asset to another. Let us consider each of these reasons in turn.
Risk Reduction Through Diversification
It is a well-known investment principle that you shouldn’t put all of your eggs into one basket. After all, what might seem to be a no-lose, high-reward situation at the outset may turn out to be a loser in the long run. Investing in more than one vehicle helps to cushion your portfolio in case one of your selections does not turn out to be as profitable as was originally expected. Asset allocation involves a lot more than just buying several different stocks; it also encompasses cash, bonds, and inflation hedge assets. In its purest form, the asset allocation process would also include other asset classes, such as, real estate, oil leases, annuities, and so forth. Because they are not as liquid as assets like equities and bonds, they are not considered in this article.
The simplest way to allocate assets would be to hold small amounts in a variety of financial vehicles and never sell. Such a policy would cushion a portfolio from major stock market declines like the 1987 crash. At the same time, it would also participate well in major bull markets, such as the 1982-1987 equity boom, or the 1978-1980 run up in the price of gold.
There are two problems with this approach. First, a major bull market in a specific asset such as that for equities in the 1980s would increase the proportion of that particular asset category well above the original intention. To make matters worse, this over-weighting would occur right at the most inappropriate time—the top of the market! One of the principal objectives of asset allocation is to increase the allocation of an asset class in the area of a major bottom, not at a market top. Eventually, it would become evident that this static approach would have to be adjusted or the portfolio would become skewed toward one particular asset, thereby diluting the beneficial effects of diversification.
The second disadvantage of a static approach is that it consistently fails to take full advantage of major bull markets and does little to provide protection during bear markets. No approach can guarantee full participation in every bull move or liquidation at the beginning of every bear market. Nevertheless, a continuous and conservative alteration in the asset balance as a response to changing economic environments is achievable and can result in superior, although not necessarily spectacular, results.
The idea of improving the risk/reward ratio is a key one in money management. All investments involve some kind of risk, but one of the principal objectives of investing is to limit risk as much as possible while not giving up too much on the reward side. Let’s say, for example, that the dividend yield on the Dow Jones Industrial Average (Dow Jones) was less than 3 percent. This falls well below the historical norm and is often associated with bull market peaks. It would, therefore, represent a high risk/reward. On the other hand, a yield of 5 to 5 ½ percent is unusually generous and normally has been seen only around major market lows. This would represent a low risk/reward and, other things being equal, would justify a larger than normal equity allocation.
Figure 1 — Risk Versus Reward for the S&P 500 Yield 1948 – 1991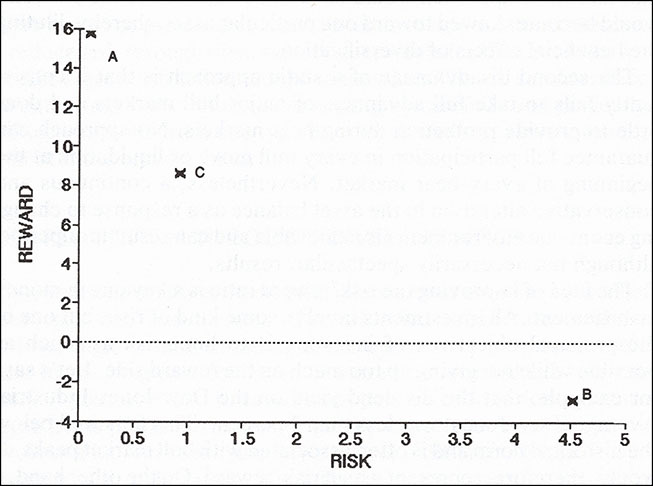
If these two extreme examples are plotted on a chart, as in Figure 1.1, it is possible to see how an investment goal of maximum return for minimum risk can be achieved. The vertical axis represents the expected reward (an annualized rate of return, for example), so the higher the reward, the closer the plot is to the top of the chart. The horizontal axis measures the risk required to earn that reward. Low risk (more desirable) would be plotted close to the vertical axis while greater risk is plotted to the right. Because the objective is to achieve maximum reward for very little risk, the risk/reward profile for the ideal investment would be plotted somewhere in the top left-hand part of the chart.
Historically, there has been an excellent buying opportunity when equities have yielded 5 percent because the downside risk has been limited and the upside potential substantial. The annualized rate of return for a two-year holding period would be plotted in the diagram at Point A, close to the risk-free area, but relatively high up on the reward scale. Conversely, purchasing stocks when the market is experiencing a 3 percent yield has, on average, offered a negative return over a 24-month holding period. This is plotted lower on the return scale and farther out on the risk axis (Point B). Point C represents the risk/reward for the entire period covered (1948-1991). Naturally, this falls between Points A and B.
Figure 2 — Risk Versus Reward for Seven Asset Classes 1940 – 1990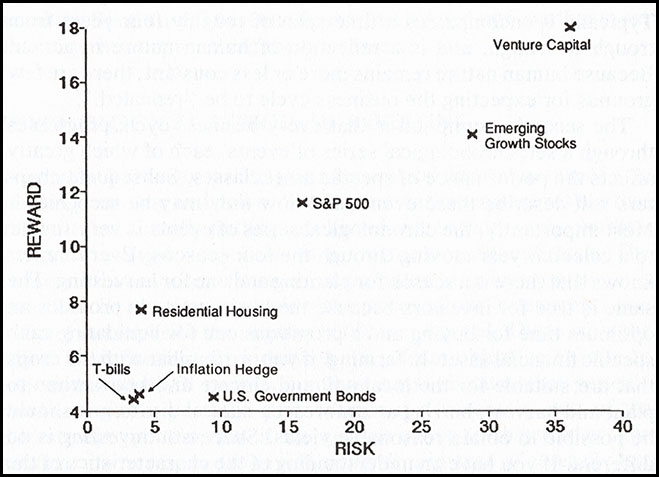
Excerpted from “The All-Season Investor”
Related Article: Managing Losses