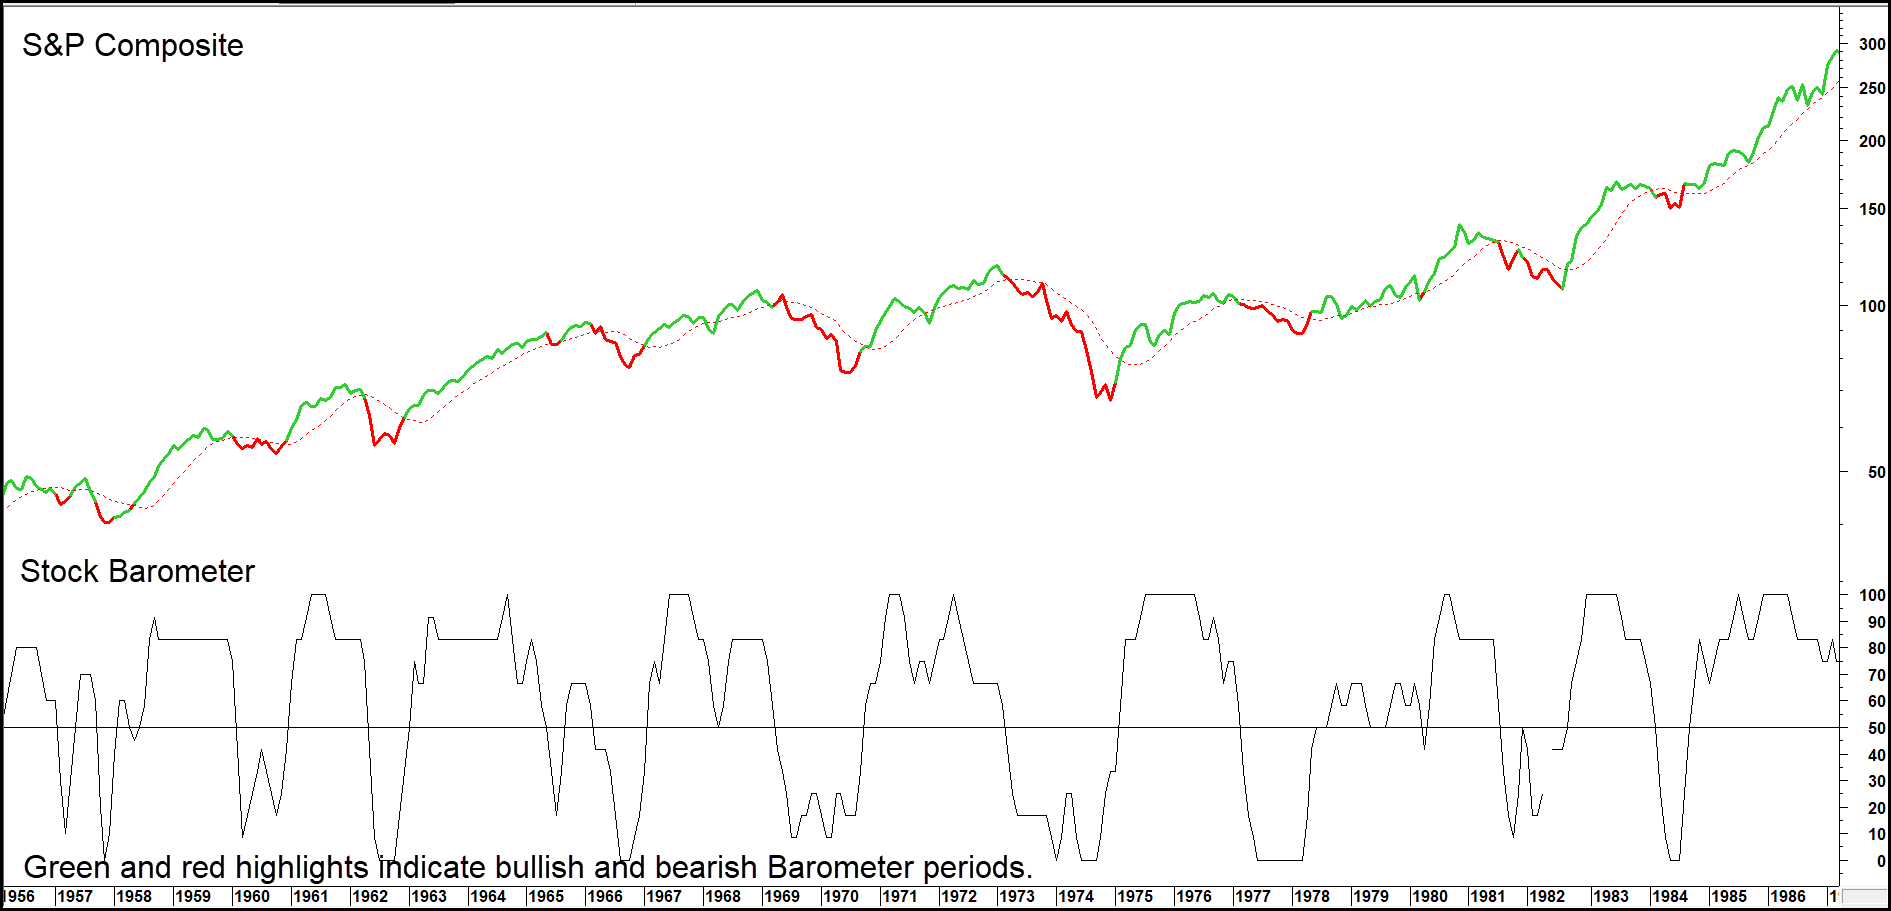
No one indicator will ever perfectly identify every major turning point in the market. However, if we incorporate several that have been reasonably consistent over a long period of time, greater reliability is achieved. It’s also important to back test over many decades by incorporating periods of inflation, deflation and crises in order to end up with a robust product. We call this consensus indicator the Stock Barometer. It’s designed to identify primary trend reversals in the equity market. This model has a score between 0 and 100%. A reading of 50% or higher is bullish and below 50% is bearish. Without getting into details, the Stock Barometer comprises six components: Two involve momentum and price trends for the S&P Composite, one embraces the relationship between the total return on stocks over cash and another monitors the trend of short-term interest rates. The final two components track the relative performance of stocks to bonds and commodities.
One reason why it requires many different types of indicators lies in the fact that every cycle has different characteristics. Each is also influenced by the direction and maturity of the secular, or very long-term trend.
It’s an easy task to look back and construct a model that has an almost perfect track record. You just invent rules that fit the data. This approach is counterproductive of course, because investors are interested in the future. The past is only helpful because it teaches us what conditions have historically been bullish and those which have traditionally been negative. If we include too many rules, the resulting model will be designed to fit the data, not reflect future environments. Paradoxically, it’s necessary to reduce the accuracy of the model in order for it to more reliably reflect conditions going forward.
Another objective is that buy and sell signals stay in force for a relatively long time, say one year or longer. If the model changes its status every three months, it will result in confusion since this ever- changing picture will not give us the confidence that the cycle really is rotating from one phase to the next. It’s far better for the signals to be less timely so they are more likely to remain in force for an extended period.
What It Cannot Do
The Stock Barometer assumes the normal unraveling of the business cycle. Therefore, it can’t operate efficiently under volatile circumstances, such as the random 1987 crash. Remember, if we try to enhance our investment returns in a deliberate incremental way, success is far more likely than if we try to go for the unattainable goal of perfection.
Stocks are the only one of the three principal markets that are driven by purely psychological forces. The other two are bonds and commodities. There is never a reason why anyone has to buy stocks, but manufacturers do continually need to purchase raw materials. Alternatively, companies may be forced to sell bonds in order to finance capital spending, etc. These motivations are based on need rather than psychology. This psychological aspect of equity trading and investing makes it more difficult to design a model that can correctly and consistently time major price reversals. Generally speaking, easy monetary conditions and the prospect of an improving economy, and therefore profits, provide the background for rising stock prices and vice versa. That’s why this model includes two components related to short-term interest rates.
This Barometer, like the other two (Inflation and Bonds) draws on past relationships to project future trends and isolate important turning points. This approach is valid with the following conditions:
- The history of each individual component is researched back over many different business cycles in both periods of secular inflationary and deflationary trends.
- The sensitivity of equity prices to these components has not suffered a material change.
- The barometer signals are a result of a consensus and are not dominated by one individual indicator or class of indicators, where a material change in the relationship stands the chance of distorting future results.
- Keeping the rules as simple and as few as possible. In this way, there is less danger of “curve fitting” in order to make the data “work” in the past. After all, we are interested in the past only to the extent that it will be better able to help us forecast the future.
We think barometer signals are more profitably applied when thought of as shades of gray, rather than black or white or buy and sell. This is because equity peaks are often rolling affairs in which prices experience extended trading ranges. Under such an environment equity exposure should be steadily reduced as risks mount, rather than being completely liquidated overnight. The barometer has therefore been designed to go negative as the trading range is developing, so time can be taken in re-adjusting portfolios.
By the same token, market bottoms are often preceded by a sharp final dell-off. This can be a very scary affair, so the barometer has been designed to identify bullish periods for equities after the market has reached its final lows, but not with too great a time lag.
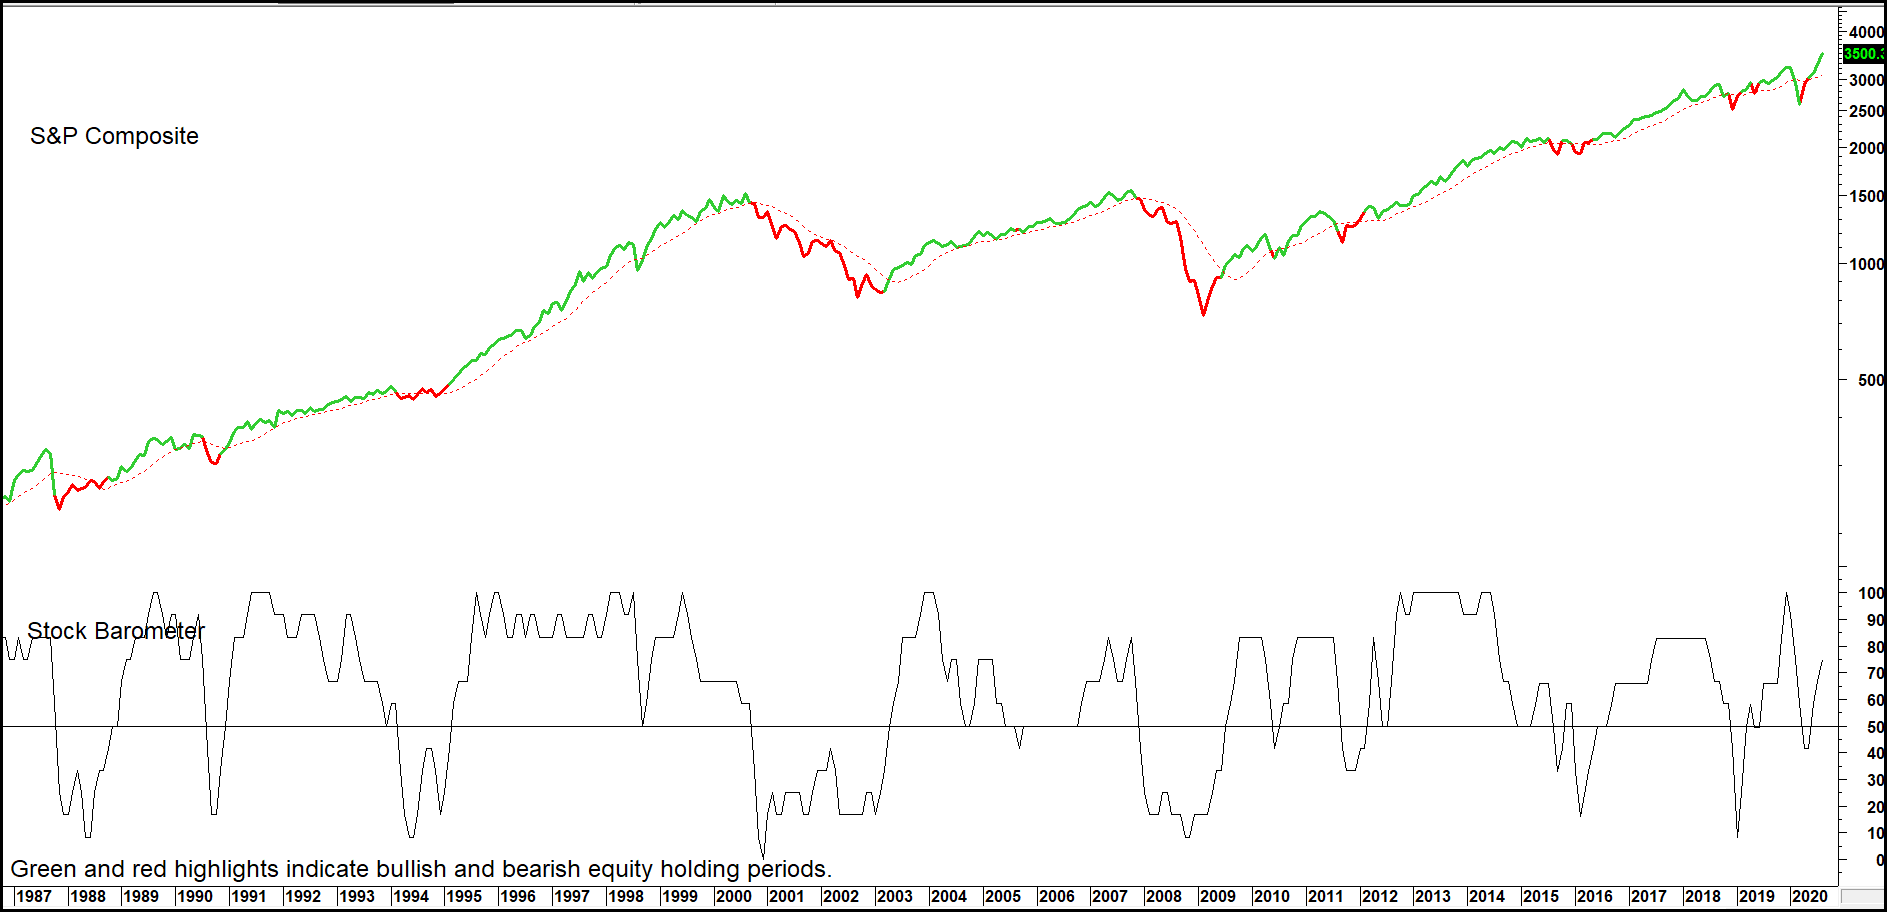
Remember, the primary investment rule is to conserve capital and avoid excessive risk. Consequently, the barometer would have kept investors away from the bulk of the devastating 2000-02 and 2007-09 bear markets.
Chart 1 — The S&P Composite Versus the Stock Barometer 1956 – 1987

If the objective of this model is to identify bear/bull turning points with pinpoint accuracy, it has certainly has its moments of failure, such as the late turning points in 1963, 1978,1988 and 2012. However, it’s main function is to keep investors out of trouble. Apart from 1987 and to a lesser extent 1957, it has certainly managed to do so.
Chart 2 — The S&P Composite Versus the Stock Barometer 1987 – 2020
Related Articles: Total Return Model, Unstable Commodity Model
